Opinion & Analysis
What factors are most important in Strokes Gained Putting?
As a golf statistician, I’m often asked what statistics golfers can keep to track their skills on the golf course.
For the tour players I work with, it’s easy. The PGA Tour uses a laser-measuring system called “Shot Tracker” that gives me the raw data I need to help them with their game. For amateurs, it’s much more difficult. They don’t have Shot Tracker, and many golfers who create their own metrics find that it can be a time-consuming process riddled with inaccuracies.
I am constantly looking to create new types of scoring games that are based on sound statistical information. For instance, there was a fad of people using the total distance of putts made metric. The idea was this — the longer the distance of total putts a player made, the better they putted. It does not consider, however, the golfer who putts poorly and happens to make a 60-footer. Nor does it consider the golfer who putts well and leaves himself first putts that are shorter in distance.
I started to look at some other metrics that I thought would be less cumbersome to record when it came to putting. I ran this against the past history of Strokes Gained Putting on Tour and found some interesting results.
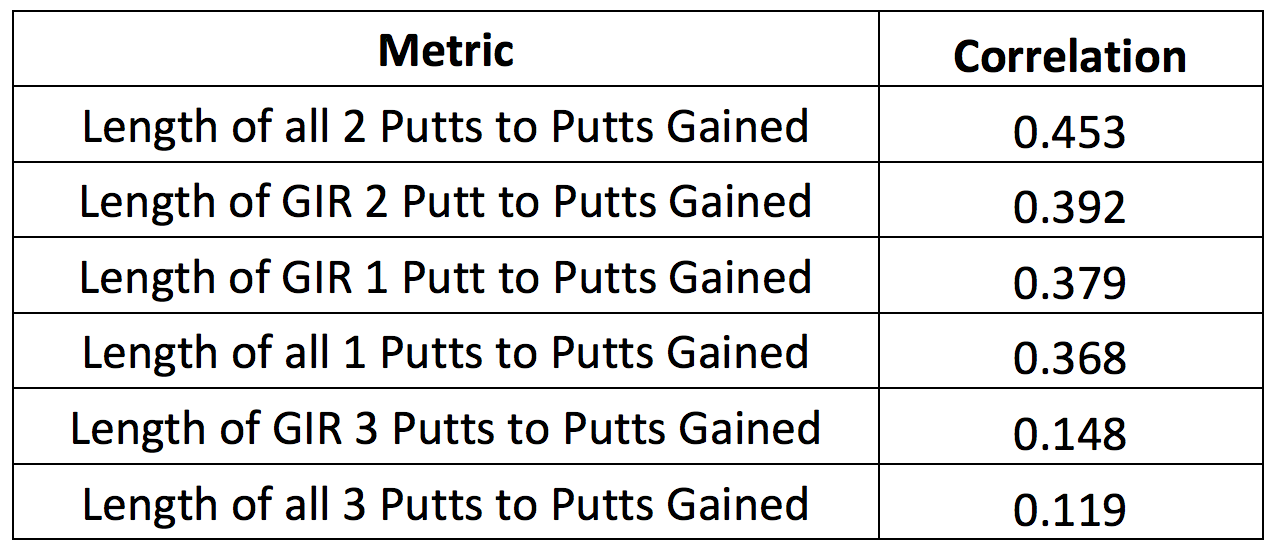
When using putting distance metrics, the average length of all two-putts has the strongest correlation to Strokes Gained Putting on Tour.
For instance, if Brandt Snedeker two putts from 30 feet, it is recorded as a two putt from 30 feet. So, if he gets on the next hole and two putts from 50 feet, then he has an average of two putting from 40 feet.
This finding surprised me. I would have thought that the average length of a one-putt or the average length of a three-putt would have had a larger correlation to Strokes Gained Putting.
In fact, here are the mathematical correlations over the years since Strokes Gained Putting has been used by the PGA Tour:
For those who don’t understand what the numbers mean, it is based on a mathematical formula used to tell the strength of a relationship between two variables. The correlation number ranges from +1 to -1. The closer the number is to +1, the stronger the direct relationship is between the two variables.
Let’s say I own a store and I want to see the relationship between lemonade sold and temperature. After I record the data, I find the correlation to be +0.9. That means that as the temperature increases so does the likelihood that I will sell more lemonade. A number closer to 0 means that there is no real relationship, and a number closer to -1 indicates a stronger, indirect relationship.
Say I owned the same store and wanted to look at hot soup sold and temperature. I may get a correlation of -0.85, which means that as the temperature falls it would be likely that I would sell more soup. But if I look at the correlation between temperature and bread sold and come up with a correlation of +0.003, then that shows that temperature has no real impact on how many loafs of bread will be sold.
The reason why I bring up these correlations is that we see that after the two-putt distance correlations, the one-putt distance correlations are right behind. There is a significant decline, however, in the correlation between three-putt distances and Strokes Gained Putting.
My conclusion as to why the two-putting distance metrics have a stronger correlation is that it is simply too difficult to putt great from course to course. I label putting “great” any time a Tour player averages +1 or more strokes gained per round for a tournament. Even the best putters on Tour tend to only putt great in roughly 30-to-40 percent of their events.
These were three of the best putters in 2014 and they putted great in 33-to-40 percent of their events.
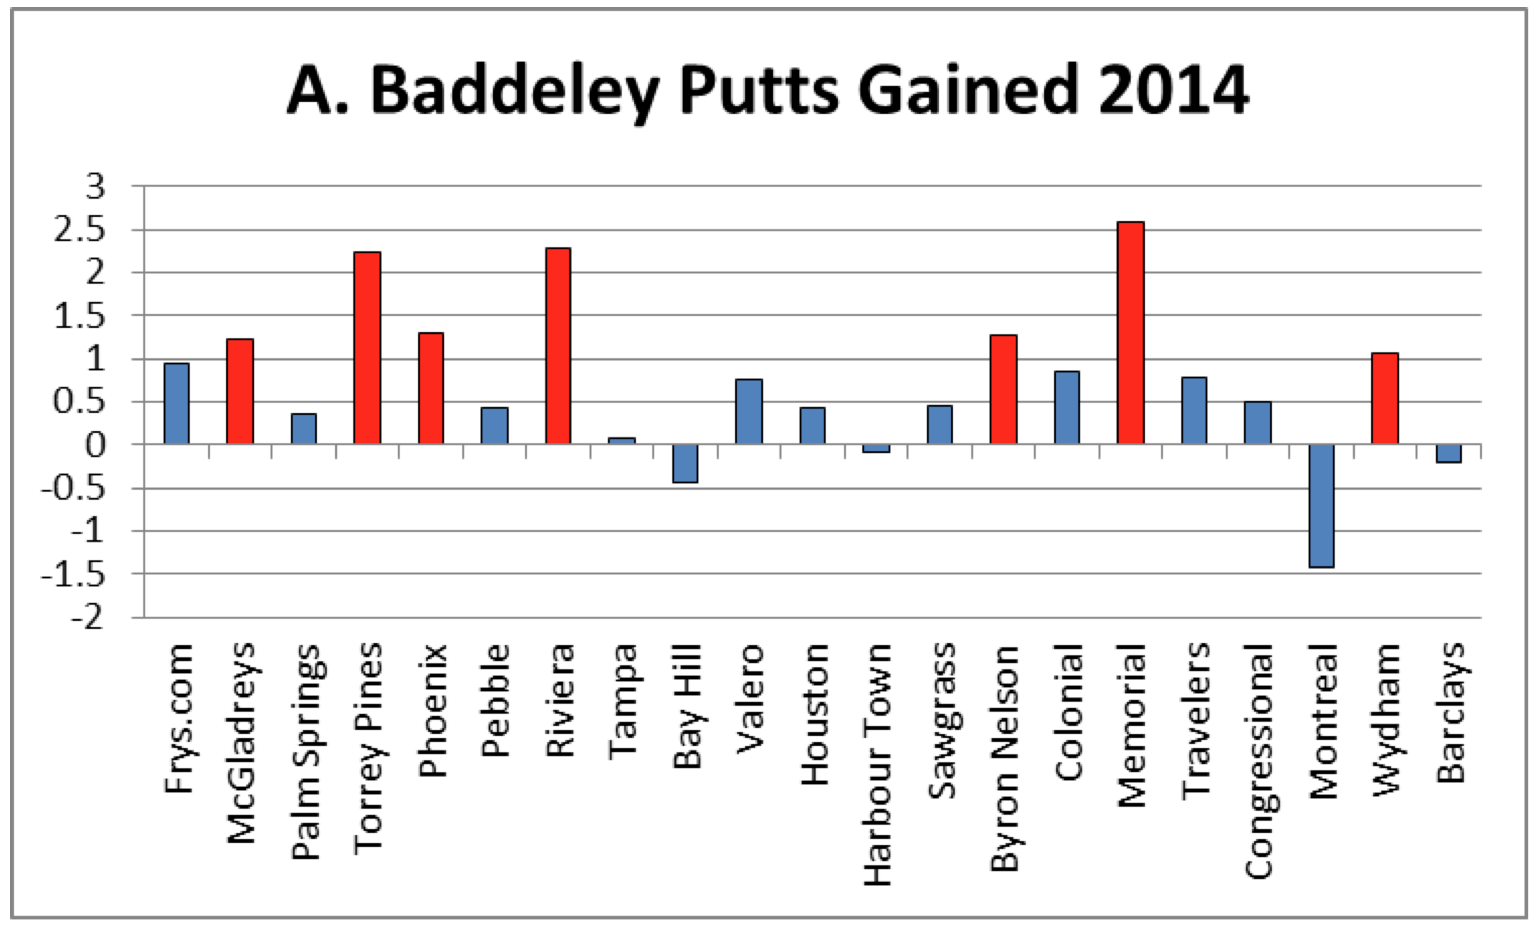
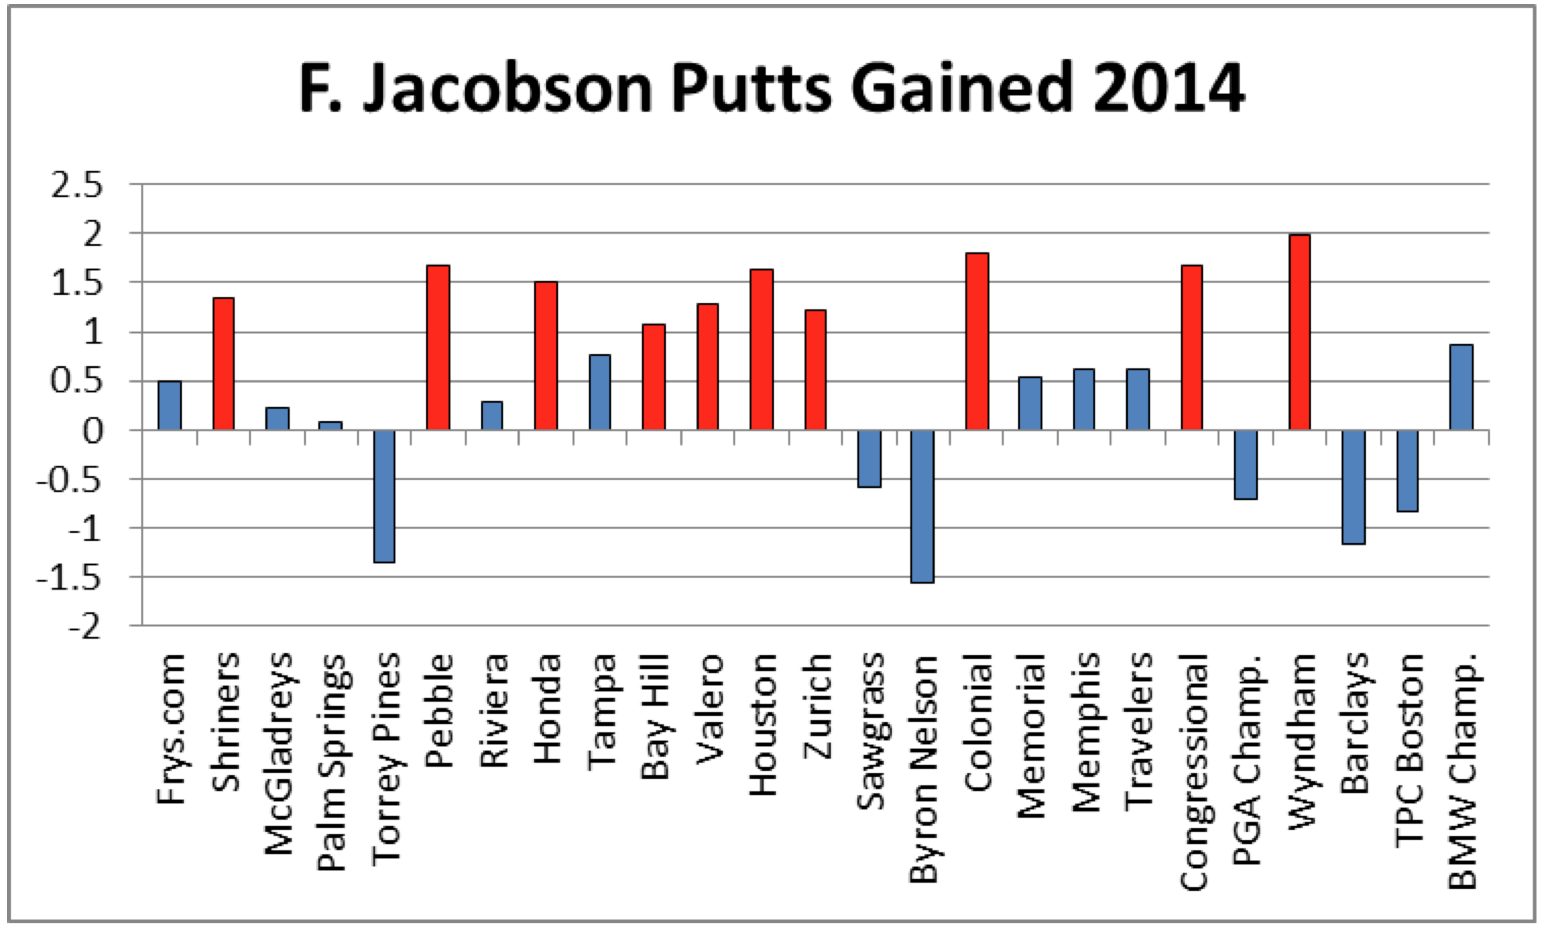
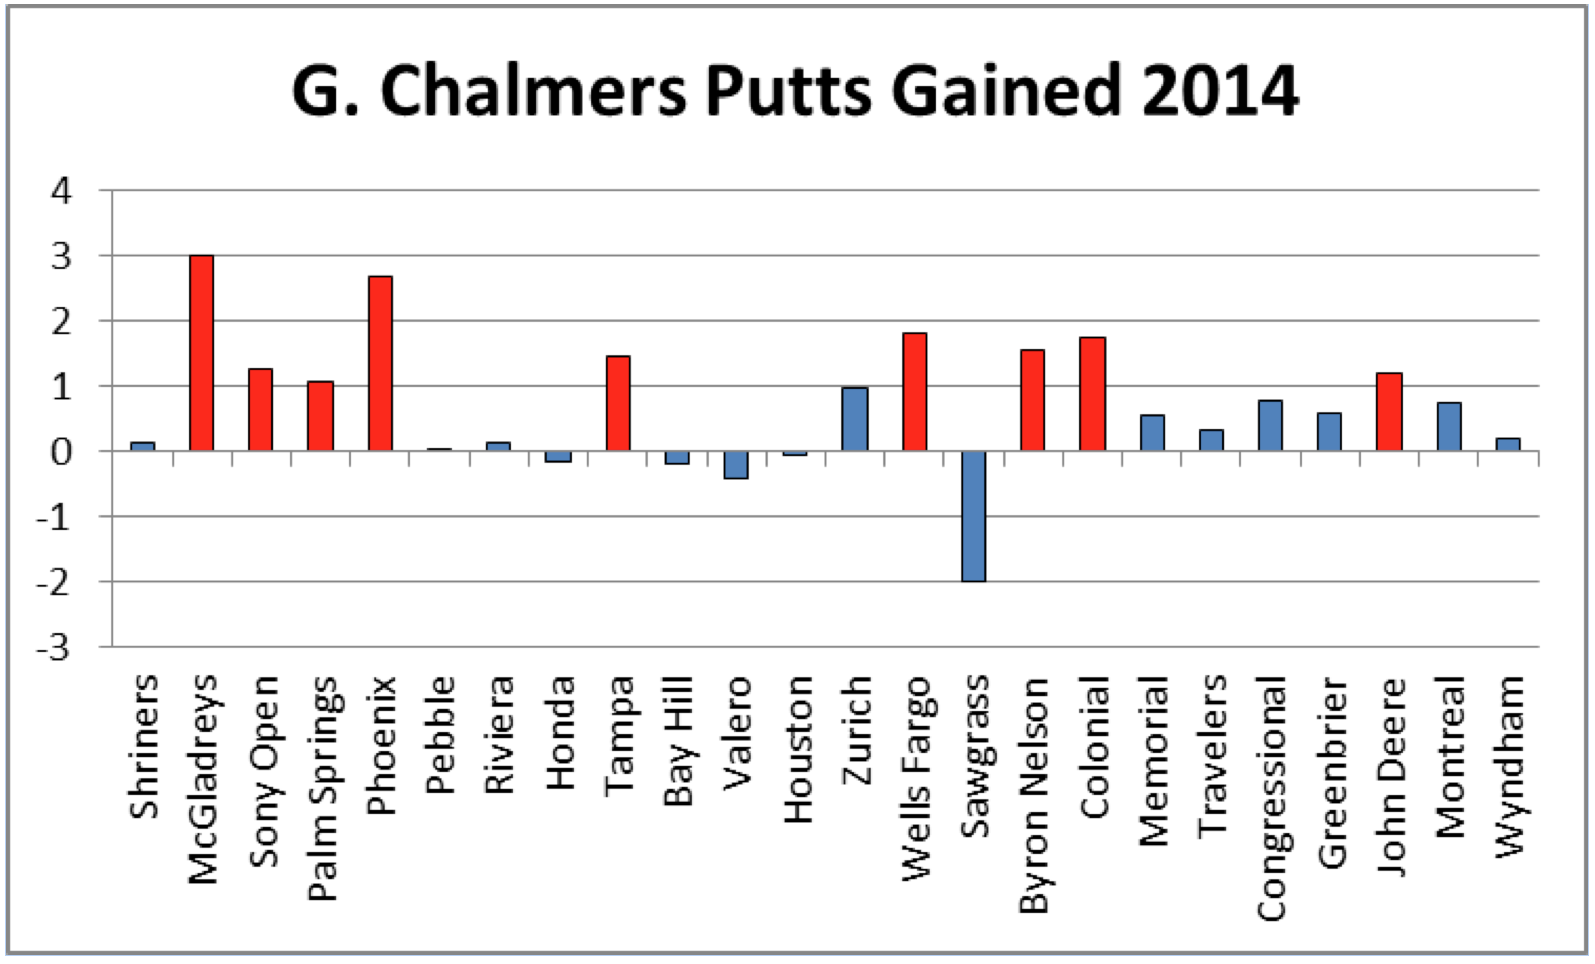
By looking at the graphs, we can see that great putting tends to occur at roughly the same time. Aaron Baddeley hit a stretch of great putting from The McGladreys through Riviera, as he putted great in 4 of those 6 events (notice the tall red bars, which indicate strokes gained on the field).
Freddie Jacobson hit his hot streak by putting great in 6 out of 8 events from Pebble Beach to the Zurich Classic. And Greg Chalmers started the year on fire by putting great in four events in a from The McGladreys to TPC Scottsdale.
Great putters also tend to cool off in streaks, however. They usually tend to putt better than the average (better than 0 strokes gained), but they can no longer rely on great putting for them to do well in a tournament. And that is where I believe why the average length of a player’s two-putts correlates strongest to Strokes Gained Putting.
But, I didn’t want to stop there. I wanted to look at a combination of metrics to help decide if there is more than one way to correlate to Strokes Gained Putting. And what I found was that if you combine the length of the average two putt along with the length of the average birdie putt made, you get the strongest correlation to Strokes Gained Putting in the end.
Let’s remember how Strokes Gained Putting is designed. If the field makes 40 percent of their putts from 10 feet, that will equate to roughly 1.6 strokes to the hole from 10 feet. If a player one-putts from 10 feet, then they are determined to have gained +0.6 strokes on the field. If they two-putt from 10 feet, then they have lost -0.4 strokes to the field.
The reason why birdie putts contribute to Strokes Gained Putting more is that they are by and large more difficult for players to make. In fact, only two PGA Tour players had a higher make percentage of birdie putts than par putts from 5-to-15 feet: Kevin Streelman and Luke Donald.
Anytime the make percentage goes down, there is more potential for a player to gain more strokes. If the make percentage from 10 feet went down to 20 percent and that roughly equates to 1.8 strokes from 10 feet, a player that makes the 10-foot putt now gains 0.8 strokes on the field.
Essentially, what this tells me is that even the best putters are not going to be able to take great putting from course to course, so they need to be two-putting when putts are not dropping for them. And when you combine the length of the two-putts along with the length of birdie putts made, it provides a measurement of ability to avoid three-putts and ability to make putts.
The average Tour player’s two-putt distance is roughly 22.5 feet, and their average birdie putt make distance is 10.5 feet. That comes to a combined 33 feet. I also wanted to test this with another metric that is fairly easy to measure: Greens in Regulation (GIR).
When combining GIR with the “Average All Two-Putts Distance” and the “Average Birdie Make Putt Distance,” it has an incredibly strong correlation to Adjusted Scoring Average.
Normally, I’m not a big fan of the greens in regulation metric due to its flaws and ambiguous nature, but considering that it is an easy metric to calculate and the correlation between greens hit and the two-putt and one-putt average distance is so high, I think it is a helpful way for a player to measure their skills.
And that’s how I came up with the “98 Score.”
Here are the Tour averages for each of the metrics:
- Average All 2-Putts Distance: 22.5 feet
- Average Birdie Putts Made Distance: 10.5 feet
- Average Greens In Regulation: 65 percent
22.5 + 10.5 + 65 = 98
If you can score 98 or better, than you are playing quite well. If not, keep trying to improve your score so you can get the ball on the green more often and putt better when you’re on the greens.
- LIKE69
- LEGIT10
- WOW8
- LOL2
- IDHT1
- FLOP11
- OB2
- SHANK7
19th Hole
Vincenzi’s 2024 PGA Championship betting preview: Rising star ready to join the immortals at Valhalla

The second major of the 2024 season is upon us as the world’s best players will tee it up this week at Valhalla Golf Club in Louisville, Kentucky to compete for the Wanamaker Trophy.
The last time we saw Valhalla host a major championship, Rory McIlroy fended off Phil Mickelson, Henrik Stenson, Rickie Fowler and the creeping darkness that was descending upon the golf course. The Northern Irishman had the golf world in the palm of his hand, joining only Tiger Woods and Jack Nicklaus as players who’d won four major championships by the time they were 25 years old.
Valhalla is named after the great hall described in Norse mythology where the souls of Vikings feasted and celebrated with the Gods. The course is a Jack Nicklaus-design that has ranked among Golf Digest’s “America’s 100 Greatest Courses” for three decades.
Valhalla Golf Club is a par-71 measuring 7,542 yards with Zoysia fairways and Bentgrass greens. The course has rolling hills and dangerous streams scattered throughout and the signature 13th hole is picturesque with limestone and unique bunkering protecting the green. The 2024 PGA Championship will mark the fourth time Valhalla has hosted the event.
The field this week will consist of 156 players, including 16 PGA Champions and 33 Major Champions.
Past Winners of the PGA Championship
- 2023: Brooks Koepka (-9) Oak Hill
- 2022: Justin Thomas (-5) Southern Hills
- 2021: Phil Mickelson (-6) Kiawah Island
- 2020: Collin Morikawa (-13) TPC Harding Park
- 2019: Brooks Koepka (-8) Bethpage Black
- 2018: Brooks Koepka (-16) Bellerive
- 2017: Justin Thomas (-8) Quail Hollow
- 2016: Jimmy Walker (-14) Baltusrol
- 2015: Jason Day (-20) Whistling Straits
- 2014: Rory McIlroy (-16) Valhalla
In this article and going forward, I’ll be using the Rabbit Hole by Betsperts Golf data engine to develop my custom model. If you want to build your own model or check out all of the detailed stats, you can sign up using promo code: MATTVIN for 25% off any subscription package (yearly is best value).
Key Stats For Valhalla
Let’s take a look at five key metrics for Oak Hill to determine which golfers boast top marks in each category over their past 24 rounds.
1. Strokes Gained: Approach
Valhalla will play as a true all-around test of golf for the world’s best. Of course, it will take strong approach play to win a major championship.
Strokes Gained: Approach Over Past 24 Rounds
- Shane Lowry (+1.25)
- Scottie Scheffler (+1.09)
- Jordan Smith (+1.05)
- Tom Hoge (+.96)
- Corey Conners (+.94)
2. Strokes Gained: Off the Tee
Valhalla will play long and the rough will be penal. Players who are incredibly short off the tee and/or have a hard time hitting fairways will be all but eliminated from contention this week at the PGA Championship.
Strokes Gained: Off the Tee Over Past 24 Rounds:
- Bryson DeChambeau (+1.47)
- Scottie Scheffler (+1.11)
- Keith Mitchell (+.90)
- Alejandro Tosti (+.89)
- Ludvig Aberg (+.82)
Strokes Gained: Total on Nickalus Designs
Valhalla is a classic Nicklaus Design. Players who play well at Nicklaus designs should have an advantage coming into this major championship.
Strokes Gained: Total on Nicklaus Designs over past 36 rounds:
- Jon Rahm (+2.56)
- Scottie Scheffler (+2.48)
- Patrick Cantlay (+2.35)
- Collin Morikawa (+1.79)
- Shane Lowry (+1.57)
Strokes Gained: Tee to Green on Very Long Courses
Valhalla is going to play extremely long this week. Players who have had success playing very long golf courses should be better equipped to handle the conditions of this major championship.
Strokes Gained: Total on Very Long Courses Over Past 24 Rounds:
- Scottie Scheffler (+2.44)
- Rory McIlroy (+2.24)
- Will Zalatoris (+1.78)
- Viktor Hovland (+1.69)
- Xander Schauffele (+1.60)
Strokes Gained: Total in Major Championships
One factor that tends to play a large role in deciding major championships is which players have played well in previous majors leading up to the event.
Strokes Gained: Total in Major Championships over past 20 rounds:
- Scottie Scheffler (+3.14)
- Will Zalatoris (+2.64)
- Rory McIlroy (+2.49)
- Xander Schauffele (+2.48)
- Tommy Fleetwood (2.09)
Strokes Gained: Putting on Bentgrass Greens
Valhalla features pure Bentgrass putting surfaces. Players who are comfortable putting on this surface will have an advantage on the greens.
Strokes Gained: Putting on Bentgrass Greens over Past 24 Rounds:
- Ludvig Aberg (+1.12)
- Denny McCarthy (+1.08)
- Matt Fitzpatrick (+0.99)
- Justin Rose (+0.93)
- J.T. Poston (0.87)
Strokes Gained: Total on Zoysia Fairways
Valhalla features Zoysia fairways. Players who are comfortable playing on this surface will have an advantage on the field.
Strokes Gained: Total on Zoysia Fairways over past 36 rounds:
- Justin Thomas (+1.53)
- Will Zalatoris (+1.47)
- Xander Schauffele (+1.40)
- Brooks Koepka (+1.35)
- Rory McIlroy (+1.23)
2024 PGA Championship Model Rankings
Below, I’ve compiled overall model rankings using a combination of the key statistical categories previously discussed — SG: Approach (25%), SG: Off the Tee (22%), SG: T2G on Very Long Courses (12%), SG: Putting on Bentgrass (+12%), SG: Total on Nicklaus Designs (12%). SG: Total on Zoysia Fairways (8%), and SG: Total in Major Championships (8%).
- Brooks Koepka
- Xander Schauffele
- Rory McIlroy
- Scottie Scheffler
- Bryson DeChambeau
- Shane Lowry
- Alex Noren
- Will Zalatoris
- Cameron Young
- Keith Mitchell
- Hideki Matsuyama
- Billy Horschel
- Patrick Cantlay
- Viktor Hovland
- Adam Schenk
- Chris Kirk
- Sahith Theegala
- Min Woo Lee
- Joaquin Niemann
- Justin Thomas
2024 PGA Championship Picks
Ludvig Aberg +1800 (BetMGM)
At The Masters, Ludvig Aberg announced to the golf world that he’s no longer an “up and coming” player. He’s one of the best players in the game of golf, regardless of experience.
Augusta National gave Aberg some necessary scar tissue and showed him what being in contention at a major championship felt like down the stretch. Unsurprisingly, he made a costly mistake, hitting it in the water left of the 11th hole, but showed his resilience by immediately bouncing back. He went on to birdie two of his next three holes and finished in solo second by three shots. With the type of demeanor that remains cool in pressure situations, I believe Ludvig has the right mental game to win a major at this point in his career.
Aberg has not finished outside of the top-25 in his past eight starts, which includes two runner-up finishes at both a “Signature Event” and a major championship. The 24-year-old is absolutely dominant with his driver, which will give him a major advantage this week. In the field he ranks, in Strokes Gained: Off the Tee, and has gained strokes in the category in each of his past ten starts. Aberg is already one of the best drivers of the golf ball on the planet.
In Norse mythology, Valhalla is the great hall where the souls of Vikings feasted and celebrated with the Gods. The Swedes, who are of Old Norse origin, were the last of the three Scandinavian Kingdoms to abandon the Old Norse Gods. A Swede played a major role in the 2014 PGA Championship at Valhalla, and I believe another, Ludvig Aberg, will be the one to conquer Valhalla in 2024.
Bryson DeChambeau +2800 (BetMGM)
Bryson DeChambeau is one of the few players in the world that I believe has the game to go blow-for-blow with Scottie Scheffler. Although he isn’t as consistent as Scheffler, when he’s at his best, Bryson has the talent to beat him.
At The Masters, DeChambeau put forth a valiant effort at a golf course that simply does not suit his game. Valhalla, on the other hand, is a course that should be perfect for the 30-year-old. His ability to overpower a golf course with his driver will be a serious weapon this week.
Bryson has had some success at Jack Nicklaus designs throughout his career as he won the Memorial at Muirfield Village back in 2018. He’s also had incredible results on Bentgrass greens for the entirety of his professional career. Of his 10 wins, nine of them have come on Bentgrass greens, with the only exception being the Arnold Palmer Invitational at Bay Hill. He also has second place finishes at Medinah and TPC Summerlin, which feature Bentgrass greens.
Love him or hate him, it’s impossible to argue that Bryson isn’t one of the most exciting and important players in the game of golf. He’s also one of the best players in the world. A second major is coming soon for DeChambeau, and I believe he should be amongst the favorites to hoist the Wanamaker Trophy this week.
Patrick Cantlay +4000 (FanDuel)
There’s no way of getting around it: Patrick Cantlay has been dissapointing in major championships throughout his professional career. He’s been one of the top players on Tour for a handful of years and has yet to truly contend at a major championship, with the arguable exception of the 2019 Masters.
Despite not winning majors, Cantlay has won some big events. The 32-year-old has won two BMW Championships, two Memorial Tournaments as well as a Tour Championship. His victories at Memorial indicate how much Cantlay loves Nicklaus designs, where he ranks 3rd in the field in Strokes Gained: Total over his past 36 rounds behind only Scottie Scheffler and Jon Rahm.
Cantlay also loves Bentgrass greens. Six of Cantlay’s seven individual wins on the PGA Tour have come on Bentgrass greens and he also was one of the best putters at the 2023 Ryder cup at Marco Simone (also Bentgrass). At Caves Valley (2021 BMW Championship), he gained over 12 strokes putting to outduel another Bentgrass specialist, Bryson DeChambeau.
Cantlay finished 22nd in The Masters, which was a solid result considering how many elite players struggled that week. He also has two top-ten finishes in his past five PGA Championships. He’s undeniably one of the best players in the field, therefore, it comes down to believing Cantlay has the mental fortitude to win a major, which I do.
Joaquin Niemann +4000 (BetMGM)
I believe Joaquin Niemann is one of the best players in the world. He has three worldwide wins since December and has continued to improve over the course of his impressive career thus far. Still only 25, the Chilean has all the tools to be a serious contender in major championships for years to come.
Niemann has been the best player on LIV this season. Plenty will argue with the format or source of the money on LIV, but no one can argue that beating players such as Jon Rahm, Bryson DeChambeau, Dustin Johnson, Brooks Koepka and Cameron Smith is an unremarkable achievement. Niemann is an elite driver of the golf ball who hits it farther than just about anyone in the field not named Bryson DeChambeau or (arguably) Rory McIlroy.
Niemann is another player who has been fantastic throughout his career on Bentgrass greens. Prior to leaving the PGA Tour, Bentgrass was the only green surface in which Joaco was a positive putter. It’s clearly a surface that he is very comfortable putting on and should fare around and on the greens this week.
Niemann is a perfect fit for Valhalla. His low and penetrating ball flight will get him plenty of runout this week on the fairways and he should have shorter shots into the green complexes than his competitors. To this point in his career, the former top ranked amateur in the world (2018) has been underwhelming in major championships, but I don’t believe that will last much longer. Joaquin Niemann is a major championship caliber player and has a real chance to contend this week at Valhalla.
- LIKE14
- LEGIT6
- WOW1
- LOL0
- IDHT0
- FLOP2
- OB0
- SHANK4
In my last post, I explained the basic performance dynamics of “smash factor” and “gear effect” as they apply to your wedges and your wedge play success. If you missed that post, you can read it here.
At the end of that post, I promised “part 2” of this discussion of what makes a wedge work the way it does. So, let’s dive into the other two components of any wedge – the shaft and the grip.
It’s long been said that the shaft is “the engine of the golf club.” The shaft (and grip) are your only connection to all the technologies that are packed into the head of any golf club, whether it be a driver, fairway, hybrid, iron, wedge or even putter.
And you cannot ignore those two components of your wedges if your goal is optimizing your performance.
I’ve long been an advocate of what I call a “seamless transition” from your irons into your wedges, so that the feel and performance do not disconnect when you choose a gap wedge, for example, instead of your iron-set-matching “P-club.” In today’s golf equipment marketplace, more and more golfers are making the investment of time and money to experience an iron fitting, going through trial and error and launch monitor measuring to get just the right shaft in their irons.
But then so many of those same golfers just go into a store and choose wedges off the retail display, with no similar science involved at all. And that’s why I see so many golfers with a huge disconnect between their custom-fitted irons, often with lighter and/or softer graphite or light steel shafts . . . and their off-the-rack wedges with the stock stiff steel ‘wedge flex’ shaft common to those stock offerings.
If your wedge shafts are significantly heavier and stiffer than the shafts in your irons, it is physically impossible for you to make the same swing. Period.
To quickly improve your wedge play, one of the first things you can do is have your wedges re-shafted with the same or similar shaft that is in your irons.
There’s another side of that shaft weight equation; if you don’t have the forearm and hand strength of a PGA Tour professional, you simply cannot “handle” the same weight shaft that those guys play to master the myriad of ‘touch shots’ around the greens.
Now, let’s move on to the third and other key component of your wedges – the grips. If those are not similar in shape and feel to the grips on your irons, you have another disconnect. Have your grips checked by a qualified golf club professionals to make sure you are in sync there.
The one caveat to that advice is that I am a proponent of a reduced taper in your wedge grips – putting two to four more layers of tape under the lower hand, or selecting one of the many reduced taper grips on the market. That accomplishes two goals for your scoring.
First, it helps reduce overactive hands in your full and near-full wedge swings. Quiet hands are key to good wedge shots.
And secondly, it provides a more consistent feel of the wedge in your hands as you grip down for those shorter and more delicate shots around the greens. And you should always grip down as you get into those touch shots. I call it “getting closer to your work.”
So, if you will spend as much time selecting the shafts and grips for your wedges as you do choosing the brand, model, and loft of them, your scoring range performance will get better.
More from the Wedge Guy
- The Wedge Guy: What really makes a wedge work? Part 1
- The Wedge Guy: The easiest-to-learn golf basic
- The Wedge Guy: Golf mastery begins with your wedge game
- LIKE6
- LEGIT3
- WOW0
- LOL1
- IDHT1
- FLOP0
- OB0
- SHANK5
19th Hole
Vincenzi’s 2024 Wells Fargo Championship betting preview: Tommy Fleetwood ready to finally land maiden PGA Tour title
The PGA Tour season ramps back up this week for another “signature event,” as golf fans look forward to the year’s second major championship next week.
After two weaker-field events in the Zurich Classic and the CJ Cup Byron Nelson, most of the best players in the world will head to historic Quail Hollow for one of the best non-major tournaments of the year.
Last season, Wyndham Clark won the event by four shots.
Quail Hollow is a par-71 measuring 7,521 yards that features Bermudagrass greens. The tree-lined, parkland style course can play quite difficult and features one of the most difficult three-hole stretches in golf known as “The Green Mile,” which makes up holes 16-18: two mammoth par 4s and a 221-yard par 3. All three holes have an average score over par, and water is in play in each of the last five holes on the course.
The field is excellent this week with 68 golfers teeing it up without a cut. All of the golfers who’ve qualified are set to tee it up, with the exception of Scottie Scheffler, who is expecting the birth of his first child.
Past Winners at Quail Hollow
- 2023: Wyndham Clark (-19)
- 2022: Max Homa (-8)
- 2021: Rory McIlroy (-10)
- 2019: Max Homa (-15)
- 2018: Jason Day (-12)
- 2017: Justin Thomas (-8) (PGA Championship)
- 2016: James Hahn (-9)
- 2015: Rory McIlroy (-21)
Key Stats For Quail Hollow
Strokes Gained: Approach
Strokes gained: Approach will be extremely important this week as second shots at Quail Hollow can be very difficult.
Total SG: Approach Over Past 24 Rounds
- Akshay Bhatia (+1.16)
- Tom Hoge (+1.12)
- Corey Conners (+1.01)
- Shane Lowry (+0.93)
- Austin Eckroat (+0.82)
Strokes Gained: Off the Tee
Quail Hollow is a long course on which it is important to play from the fairway. Both distance and accuracy are important, as shorter tee shots will result in approach shots from 200 or more yards. With most of the holes heavily tree lined, errant drives will create some real trouble for the players.
Strokes Gained: Off the Tee Past 24 Rounds:
- Ludvig Aberg (+0.73)
- Rory McIlroy (+0.69)
- Xander Schauffele (+0.62)
- Viktor Hovland (+0.58)
- Chris Kirk (+0.52)
Proximity: 175-200
The 175-200 range is key at Quail Hollow. Players who can hit their long irons well will rise to the top of the leaderboard.
Proximity: 175-200+ over past 24 rounds:
- Cameron Young (28’2″)
- Akshay Bhatia (29’6″)
- Ludvig Aberg (+30’6″)
- Sam Burns (+30’6″)
- Collin Morikawa (+30’9″)
SG: Total on Tom Fazio Designs
Players who thrive on Tom Fazio designs get a bump for me at Quail Hollow this week.
SG: Total on Tom Fazio Designs over past 36 rounds:
- Patrick Cantlay (+2.10)
- Rory McIlroy (+1.95)
- Tommy Fleetwood (+1.68)
- Austin Eckroat (+1.60)
- Will Zalatoris (+1.57)
Strokes Gained: Putting (Bermudagrass)
Strokes Gained: Putting has historically graded out as the most important statistic at Quail Hollow. While it isn’t always predictable, I do want to have it in the model to bump up golfers who prefer to putt on Bermudagrass.
Strokes Gained: Putting (Bermudagrass) Over Past 24 Rounds:
- Taylor Moore (+0.82)
- Nick Dunlap (+.76)
- Wyndham Clark (+.69)
- Emiliano Grillo (+.64)
- Cam Davis (+.61)
Course History
This stat will incorporate players that have played well in the past at Quail Hollow.
Course History over past 36 rounds (per round):
- Rory McIlroy (+2.50)
- Justin Thomas (+1.96)
- Jason Day (+1.92)
- Rickie Fowler (+1.83)
- Viktor Hovland (+1.78)
Wells Fargo Championship Model Rankings
Below, I’ve compiled overall model rankings using a combination of the five key statistical categories previously discussed — SG: Approach (27%), SG: Off the Tee (23%), SG: Total on Fazio designs (12%), Proximity: 175-200 (12%), SG: Putting Bermuda grass (12%), and Course History (14%).
- Wyndham Clark
- Rory McIlroy
- Xander Schauffele
- Shane Lowry
- Hideki Matsuyama
- Viktor Hovland
- Cameron Young
- Austin Eckroat
- Byeong Hun An
- Justin Thomas
2024 Wells Fargo Championship Picks
Tommy Fleetwood +2500 (DraftKings)
I know many out there have Tommy fatigue when it comes to betting, which is completely understandable given his lack of ability to win on the PGA Tour thus far in his career. However, history has shown us that players with Fleetwood’s talent eventually break though, and I believe for Tommy, it’s just a matter of time.
Fleetwood has been excellent on Tom Fazio designs. Over his past 36 rounds, he ranks 3rd in the field in Strokes Gained: Total on Fazio tracks. He’s also been incredibly reliable off the tee this season. He’s gained strokes in the category in eight of his past nine starts, including at The Masters, the PLAYERS and the three “signature events” of the season. Tommy is a golfer built for tougher courses and can grind it out in difficult conditions.
Last year, Fleetwood was the first-round leader at this event, firing a Thursday 65. He finished the event in a tie for 5th place.
For those worried about Fleetwood’s disappointing start his last time out at Harbour Town, he’s bounced back nicely after plenty of poor outings this season. His T7 at the Valero Texas Open was after a MC and T35 in his prior two starts and his win at the Dubai Invitational came after a T47 at the Sentry.
I expect Tommy to bounce back this week and contend at Quail Hollow.
Justin Thomas +3000 (DraftKings)
It’s been a rough couple of years for Justin Thomas, but I don’t believe things are quite as bad as they seem for JT. He got caught in the bad side of the draw at Augusta for last month’s Masters and has gained strokes on approach in seven of his nine starts in 2024.
Thomas may have found something in his most recent start at the RBC Heritage. He finished T5 at a course that he isn’t the best fit for on paper. He also finally got the putter working and ranked 15th in Strokes Gained: Putting for the week.
The two-time PGA champion captured the first of his two major championships at Quail Hollow back in 2017, and some good vibes from the course may be enough to get JT out of his slump.
Thomas hasn’t won an event in just about two years. However, I still believe that will change soon as he’s been one of the most prolific winners throughout his PGA Tour career. Since 2015, he has 15 PGA Tour wins.
Course history is pretty sticky at Quail Hollow, with players who like the course playing well there on a regular basis. In addition to JT’s PGA Championship win in 2017, he went 4-1 at the 2022 Presidents Cup and finished T14 at the event last year despite being in poor form. Thomas can return as one of the top players on the PGA Tour with a win at a “signature event” this week.
Cameron Young +3500 (DraftKings)
For many golf bettors, it’s been frustrating backing Cam Young this season. His talent is undeniable, and one of the best and most consistent performers on the PGA Tour. He just hasn’t broken through with a victory yet. Quail Hollow has been a great place for elite players to get their first victory. Rory McIlroy, Anthony Kim, Rickie Fowler and Wyndham Clark all notched their first PGA Tour win at Quail.
Throughout Cam Young’s career, he has thrived at tougher courses with strong fields. This season, he finished T16 at Riviera and T9 at Augusta National, demonstrating his preference of a tough test. His ability to hit the ball long and straight off the tee make him an ideal fit for Quail Hollow, despite playing pretty poorly his first time out in 2023 (T59). Young should be comfortable playing in the region as he played his college golf at Wake Forest, which is about an hour’s drive from Quail Hollow.
The 26-year-old has played well at Tom Fazio designs in the past and ranks 8th in the field in Strokes Gained: Total on those courses in his last 36 rounds. Perhaps most importantly, this season, Young is the best player on the PGA Tour in terms of proximity from 175-200 in the fairway, which is where a plurality and many crucial shots will come from this week.
Young is an elite talent and Quail Hollow has been kind to players of his ilk who’ve yet to win on Tour.
Byeong Hun An +5000 (FanDuel)
Byeong Hun An missed some opportunities last weekend at the CJ Cup Byron Nelson. He finished T4 and played some outstanding golf, but a couple of missed short putts prevented him from getting to the winning score of -23. Despite not getting the win, it’s hard to view An’s performance as anything other than an overwhelming success. It was An’s fourth top-ten finish of the season.
Last week, An gained 6.5 strokes ball striking, which was 7th in the field. He also ranked 12th for Strokes Gained: Approach and 13th for Strokes Gained: Off the Tee. The South Korean has been hitting the ball so well from tee to green all season long and he now heads to a golf course that should reward his precision.
An’s driver and long irons are absolute weapons. At Quail Hollow, players will see plenty of approach shots from the 175-200 range as well as some from 200+. In his past 24 rounds, Ben ranks 3rd in the field in proximity from 175-200 and 12th in proximity from 200+. Playing in an event that will not end up being a “birdie” fest should help An, who can separate from the field with his strong tee to green play. The putter may not always cooperate but getting to -15 is much easier than getting to -23 for elite ball strikers who tend to struggle on the greens.
Winning a “signature event” feels like a tall task for An this week with so many elite players in the field. However, he’s finished T16 at the Genesis Invitational, T16 at The Masters and T8 at the Arnold Palmer Invitational. The 32-year-old’s game has improved drastically this season and I believe he’s ready to get the biggest win of his career.
- LIKE9
- LEGIT4
- WOW1
- LOL1
- IDHT1
- FLOP1
- OB0
- SHANK1


Dave Portnoy places monstrous outright bet for the 2024 Masters

Things got heated at the Houston Open between Tony Finau and Alejandro Tosti. Here’s why

Justin Thomas on the equipment choice of Scottie Scheffler that he thinks is ‘weird’

Tiger Woods arrives at 2024 Masters equipped with a putter that may surprise you

‘Absolutely crazy’ – Major champ lays into Patrick Cantlay over his decision on final hole of RBC Heritage

Report: Tiger Woods has ‘eliminated sex’ in preparation for the 2024 Masters

Two star names reportedly blanked Jon Rahm all week at the Masters

Report: LIV Golf identifies latest star name they hope to sign to breakaway tour

Neal Shipley presser ends in awkward fashion after reporter claims Tiger handed him note on 8th fairway

What we know about Bryson DeChambeau’s 3D-printed Avoda irons

Michael Block WITB 2024 (May)
Michael Block what’s in the bag accurate as of the PGA Championship. Driver: TaylorMade Qi10 “Dot” (9 degrees @7.5) Shaft:...

Brooks Koepka WITB 2024 (May)
Brooks Koepka what’s in the bag accurate as of the PGA Championship. Driver: TaylorMade Qi10 “Dot” (10.5 degrees @9.75) Shaft:...

Rory McIlroy’s winning WITB: 2024 Wells Fargo Championship
Driver: TaylorMade Qi10 (9 degrees @8.25) Buy here. Shaft: Fujikura Ventus Black 6 X 3-wood: TaylorMade Qi10 (15 degrees) Buy here. Shaft:...

Kevin Tway WITB 2024 (May)
Kevin Tway what’s in the bag accurate as of the Wells Fargo Championship. More photos from the event here. Driver:...
-
 19th Hole3 weeks ago
LET pro gives detailed financial breakdown of first week on tour…and the net result may shock you
-
 19th Hole7 days ago
Report: LIV star turns down PGA Championship invite due to ‘personal commitments’
-
 19th Hole2 weeks ago
Gary Player claims this is what ‘completely ruined’ Tiger Woods’ career
-
 Equipment6 days ago
Details on Justin Thomas’ driver switch at the Wells Fargo Championship
-
 Whats in the Bag2 weeks ago
Team McIlowry (Rory McIlroy, Shane Lowry) winning WITBs: 2024 Zurich Classic
-
 Whats in the Bag7 days ago
Keegan Bradley WITB 2024 (May)
-
 Equipment2 weeks ago
Golf fans left surprised by LIV’s choice of course for its 2024 individual championship event
-
 Equipment2 weeks ago
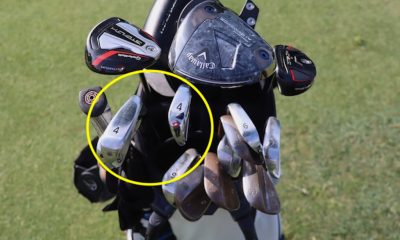
Why Wesley Bryan is playing two 4-irons this week
Trae
Feb 12, 2015 at 7:44 pm
This was a good read, and very interesting. And it brings back memories of stats class, and also me spending countless hours entering in data from the pga tour just to see relationships between variables and trying to create a number of statistical models to predict, etc. I’m never doing that again! Never got to a point where I could really apply it to my own game in a really effective way though. Always would end up getting caught up in trying to figure out why someone was an outlier, then later on lost interest in stats altogether. It’s interesting stuff but I think it can be very misleading in some cases. It can be tricky. Anyways, I enjoyed this article and I’m looking forward to your next one. Thanks.
Jeff Watson
Feb 11, 2015 at 4:32 pm
Rich,
I like it. I already pace off my putts and number of putts for a stats program I subscribe to. Any idea what the “Score” would be based on handicap?
Jeff
david
Feb 11, 2015 at 12:54 pm
Hi Ritch, I had to drop out of gread 11 math, so unfortunately my brain is still bleeding after reading your article. I know the tour putting stats on makeability is, from what I believe, from 6 feet to about 50%. I was a bit under this, so I worked hard on my putting last summer and lowered my cap from aprox 5 to 3.7. I know without keeping stats that not enough of my greenside chips get to inside 4 feet, so that is my focus this summer to knock off another 2 points. But I did find the article interesting, but not necessarily relevant to most amateurs, whatever the index.
Dick Kusleika
Feb 11, 2015 at 11:13 am
I step off every first putt. I don’t know how people putt without stepping it off. They just guess or try to feel it, I suppose.
I think the negative correlation is “inverse relationship”, not “indirect relationship”.
Hudson
Feb 10, 2015 at 2:21 pm
I calculate the strokes gained (lost in my case, lol) and measure one pace (3 feet) to get the distance on the green from the pin. It takes a few seconds and it’s dead easy.
I am going full speed to track/calculate my strokes gained now and I am explaining it there:
http://golf-made-in-us.blogspot.com/2014/04/golf-stats-revolution-gained-strokes.html
I consequently discovered that I was losing 6 strokes between 125 and 200 yards (on a 14 hcp) on average in 2014 and will work on that !
Rich Hunt
Feb 10, 2015 at 2:35 pm
Hudson, I’ve enjoyed your work. The only issue I have with using strokes gained with putting is that the make %’s at a local course are likely different then at a Tour level course, even for Tour players. As we’ve seen time and time again, slower greens mean lower make %’s for players across the board. I’ve not only seen it at Tour courses that I record the data for, but David Orr did a study on this and found the same thing as well. IMO, it is probably best to use strokes gained in comparing it to your own performance over time and see how well you improve or regress.
HIGHfader
Feb 10, 2015 at 4:49 pm
Richie, do you know where I can find that David Orr studdy?
Richie Hunt
Feb 10, 2015 at 8:13 pm
I don’t believe David has made it public. But, if you asked him that is what he would tell you. IIRC, they measured roughly 700 golfers and were on greens from the local muni to Pinehurst.
jeff
Feb 10, 2015 at 1:23 pm
Rich, great writeup, thanks. But without data from our peers (“the field”), how is this different from simply looking at your actual score for the round as a basis for judging our “getting better”? What I mean is, what will achieving a 98 in this fashion tell us about our game that the score cannot? If the result of putting better (fewer putts per round) is a better overall score, isn’t that pretty much the same thing? Without a field to compare against, how much would we actually get out of this? Thanks again!
Rich Hunt
Feb 10, 2015 at 2:18 pm
Jeff,
Very good point. I think we can use the 98 Score to measure how well we are striking the ball and putting. So the other factors that would cause a discrepancy in 98 Score versus Actual Score would be short game shots around the green, penalty shots and general strategy. So if the score is better than 98, but a player shoots 75, then they may have struggled with short game or hit a shot OB or in the drink.
In my next article I will go into simple metrics I keep for my rounds that will better help determine the strengths and weaknesses of our game.
myron miller
Feb 10, 2015 at 12:40 pm
I’m a little sceptical of your usage of the statistical correlation coefficient. Famous statistical anolmaly: Amount of ice cream eaten versus number of polio cases was fantastically high (close to .9 or something like that). Ergo if you eat a lot of Ice cream your chances of polio increased. Just because there’s a correlation doesn’t mean that there is necessarily a relationship. Usually but not necessarily. Other factors could be involved that sway the correlation coefficient.
For the amateur to actually pace off every putt regardless does help but slows down the game a bit increasing the time for the round. Not a productive way to help the overall pace of play but it does help the individual golfer (assuming his paces are moderately accurate – which is sometimes questionable). So which is more important, pace of play or helping the individual in play? At which time?
Rich Hunt
Feb 10, 2015 at 2:14 pm
Correlation does not imply causality (unless there is a correlation of a perfect +1 or -1). The issue is that people tend to take that the wrong way as correlation is trying to define the symmetry of a relationship.
The problem with the ice cream to polio correlation is that usually those types of analysis are done over a very short period of time so the sample size is not large enough. The other issue is that the variables (polio and ice cream consumption) have virtually nothing to do with each other.
Correlation is not about certainty, it’s about probability. The real issue with the correlations I used is that they are not ‘strong correlations’ (+0.5 or better), so the 1:1 relationship is not exactly a confident one. But, that could be due to a myriad of factors like a golfer’s ballstriking.
However, those correlations were fairly consistent over the seasons and on a comparative basis I think it indicates that all 2-putts length does give a better indication of how a player is putting than say 3-putt length. And given that when we combine all 2-putts and birdie putts lengths does have a strong correlation, it’s a good way to measure our true putting prowess.
Lastly, the main point of the article was to more accurately measure our own putting prowess and do it without the measuring process being too cumbersome and time consuming. Obviously, we don’t know how well we are putting versus other golfers. But we can measure our own improvement over time with a large enough sample by seeing how well we improve compared to our performance in other rounds of golf.
Rich Hunt
Feb 10, 2015 at 2:28 pm
Myron,
Correlation does not imply causality (unless the correlation is +1 or -1). However, many people don’t quite understand that phrase as used in the polio to ice cream consumption case.
Correlation is designed to give a confidence level of the symmetrical relationship between 2 variables. For instance, we may see a correlation between ball speed and distance a ball travels of +0.9. That doesn’t consider launch angle, spin rate, landing angle of the ball, etc. But we have a high degree of confidence that ball speed will be a large determining factor in the distance the ball traveled.
The problem with using the polio to ice cream consumption argument (and the countless other arguments) is that:
1) typically the sample sizes are incredibly small so the data can be easily skewed.
2) the variables have virtually nothing to do with each other.
I feel the sample size of length of putt to putts gained is more than sufficient as it took place over several seasons with roughly 180 golfers per season. I also feel that the variables (length of a putt versus putts gained) are closely tied together.
If there is a an issue with using the correlations is that none of these correlations were ‘strong’ (+0.5 or better). However, if you add all 2-putt length and birdie putt lengths, the correlation is strong.
So, why is the correlation not at a perfect +1?
Likely due to ballstriking. If a player hits a birdie putt to 4-feet and make the birdie putt, there’s not much they can do about it rather than the player that misses their 4-foot birdie putts, but makes a 20-footer. The same goes for 2-putting.
Still, the main purpose of the article was to more easily determine how well you are putting and trying to improve upon your own performance. I think if one records this data over time they can use it to better gauge how well they have putted over a certain amount of time.
Rob Rashell
Feb 10, 2015 at 11:30 am
Rich,
This stuff is fantastic, will be sharing with the players I work with.
Rob
Rich Hunt
Feb 10, 2015 at 10:42 am
Steven,
I would just recommend pacing off the initial putt. I personally pace off all of my putts except for putts inside 5-feet since I know how long they are by eye-balling it.
It doesn’t have to be a perfect measurement because the idea is to improve your score so you can improve your putting. For instance, if you average 30-feet on your 2-putts by pacing it off and in reality it is 32 feet, that’s not as important as actually improving your 2-putt average the next time you play.
steven
Feb 10, 2015 at 10:24 am
rich, how would you recommend us amateurs determine the distance of our 2 putt distances. As well our birdie putt distances. Of course theres no guarantee i make a birdie in a round of golf. but i sure as heck attempt and make a lot of 2 putts. without the use of a simulator, ill simply be estimating the distance i am away from the hole. thus limiting the reliability of an amateurs usage of your ’98’ theory. any tips? as the concept seems very well thought out, but the execution for an average player is really implausible. thanks.