Opinion & Analysis
What factors are most important in Strokes Gained Putting?
As a golf statistician, I’m often asked what statistics golfers can keep to track their skills on the golf course.
For the tour players I work with, it’s easy. The PGA Tour uses a laser-measuring system called “Shot Tracker” that gives me the raw data I need to help them with their game. For amateurs, it’s much more difficult. They don’t have Shot Tracker, and many golfers who create their own metrics find that it can be a time-consuming process riddled with inaccuracies.
I am constantly looking to create new types of scoring games that are based on sound statistical information. For instance, there was a fad of people using the total distance of putts made metric. The idea was this — the longer the distance of total putts a player made, the better they putted. It does not consider, however, the golfer who putts poorly and happens to make a 60-footer. Nor does it consider the golfer who putts well and leaves himself first putts that are shorter in distance.
I started to look at some other metrics that I thought would be less cumbersome to record when it came to putting. I ran this against the past history of Strokes Gained Putting on Tour and found some interesting results.
When using putting distance metrics, the average length of all two-putts has the strongest correlation to Strokes Gained Putting on Tour.
For instance, if Brandt Snedeker two putts from 30 feet, it is recorded as a two putt from 30 feet. So, if he gets on the next hole and two putts from 50 feet, then he has an average of two putting from 40 feet.
This finding surprised me. I would have thought that the average length of a one-putt or the average length of a three-putt would have had a larger correlation to Strokes Gained Putting.
In fact, here are the mathematical correlations over the years since Strokes Gained Putting has been used by the PGA Tour:
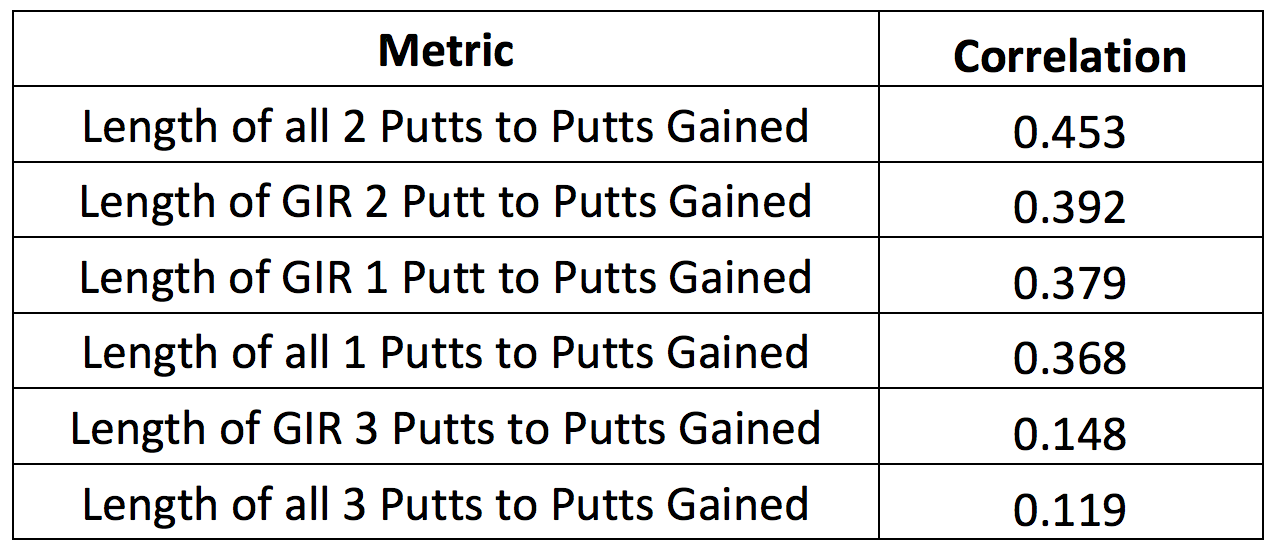
For those who don’t understand what the numbers mean, it is based on a mathematical formula used to tell the strength of a relationship between two variables. The correlation number ranges from +1 to -1. The closer the number is to +1, the stronger the direct relationship is between the two variables.
Let’s say I own a store and I want to see the relationship between lemonade sold and temperature. After I record the data, I find the correlation to be +0.9. That means that as the temperature increases so does the likelihood that I will sell more lemonade. A number closer to 0 means that there is no real relationship, and a number closer to -1 indicates a stronger, indirect relationship.
Say I owned the same store and wanted to look at hot soup sold and temperature. I may get a correlation of -0.85, which means that as the temperature falls it would be likely that I would sell more soup. But if I look at the correlation between temperature and bread sold and come up with a correlation of +0.003, then that shows that temperature has no real impact on how many loafs of bread will be sold.
The reason why I bring up these correlations is that we see that after the two-putt distance correlations, the one-putt distance correlations are right behind. There is a significant decline, however, in the correlation between three-putt distances and Strokes Gained Putting.
My conclusion as to why the two-putting distance metrics have a stronger correlation is that it is simply too difficult to putt great from course to course. I label putting “great” any time a Tour player averages +1 or more strokes gained per round for a tournament. Even the best putters on Tour tend to only putt great in roughly 30-to-40 percent of their events.
These were three of the best putters in 2014 and they putted great in 33-to-40 percent of their events.
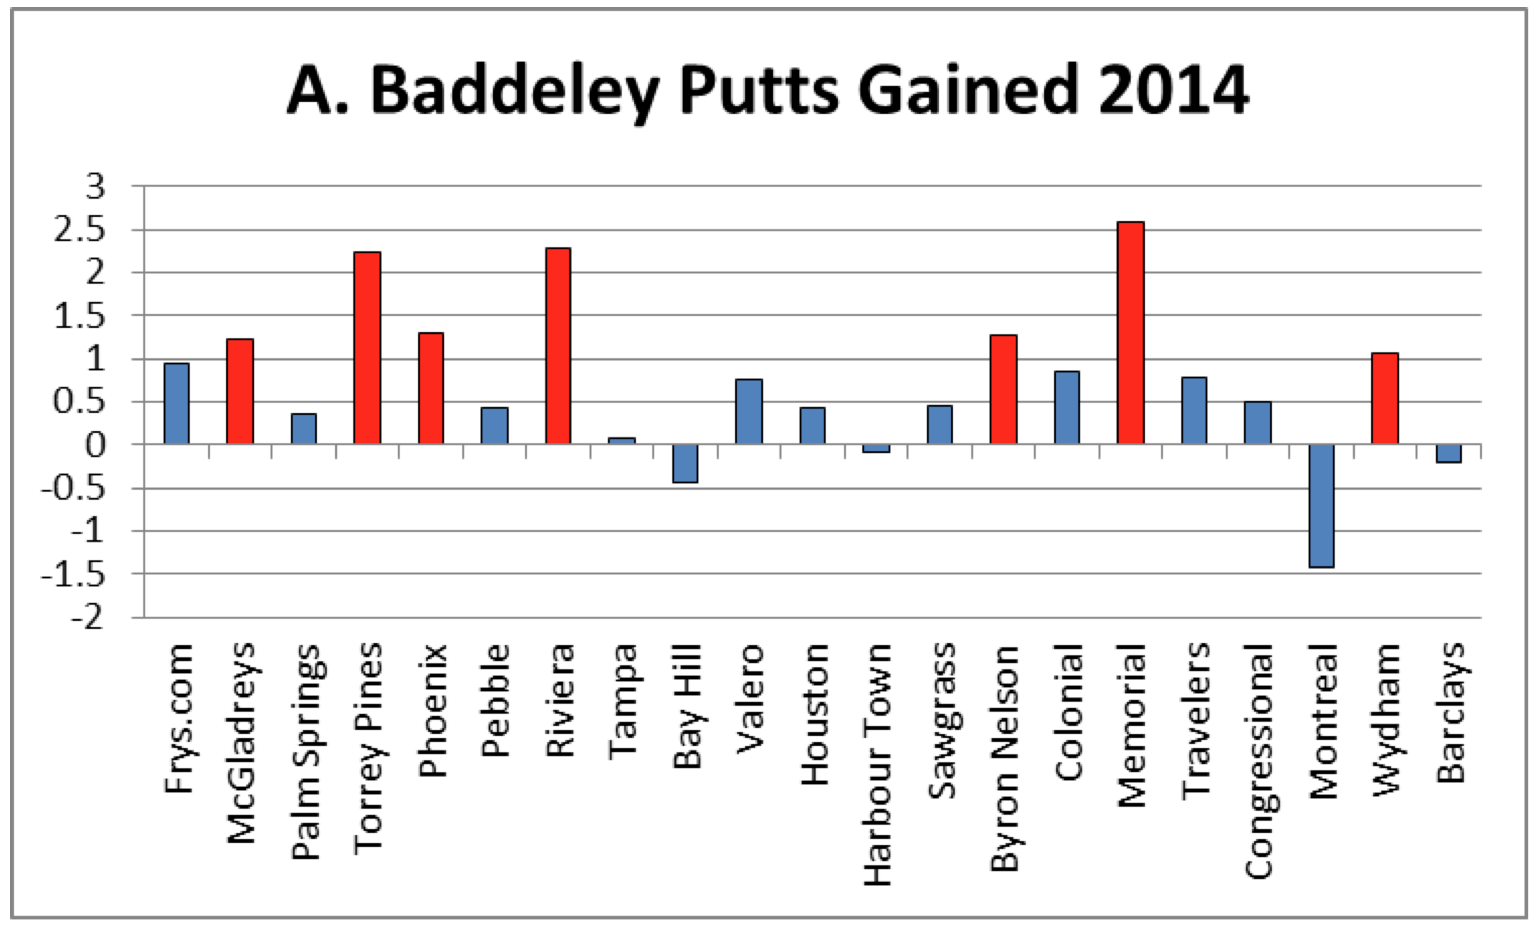
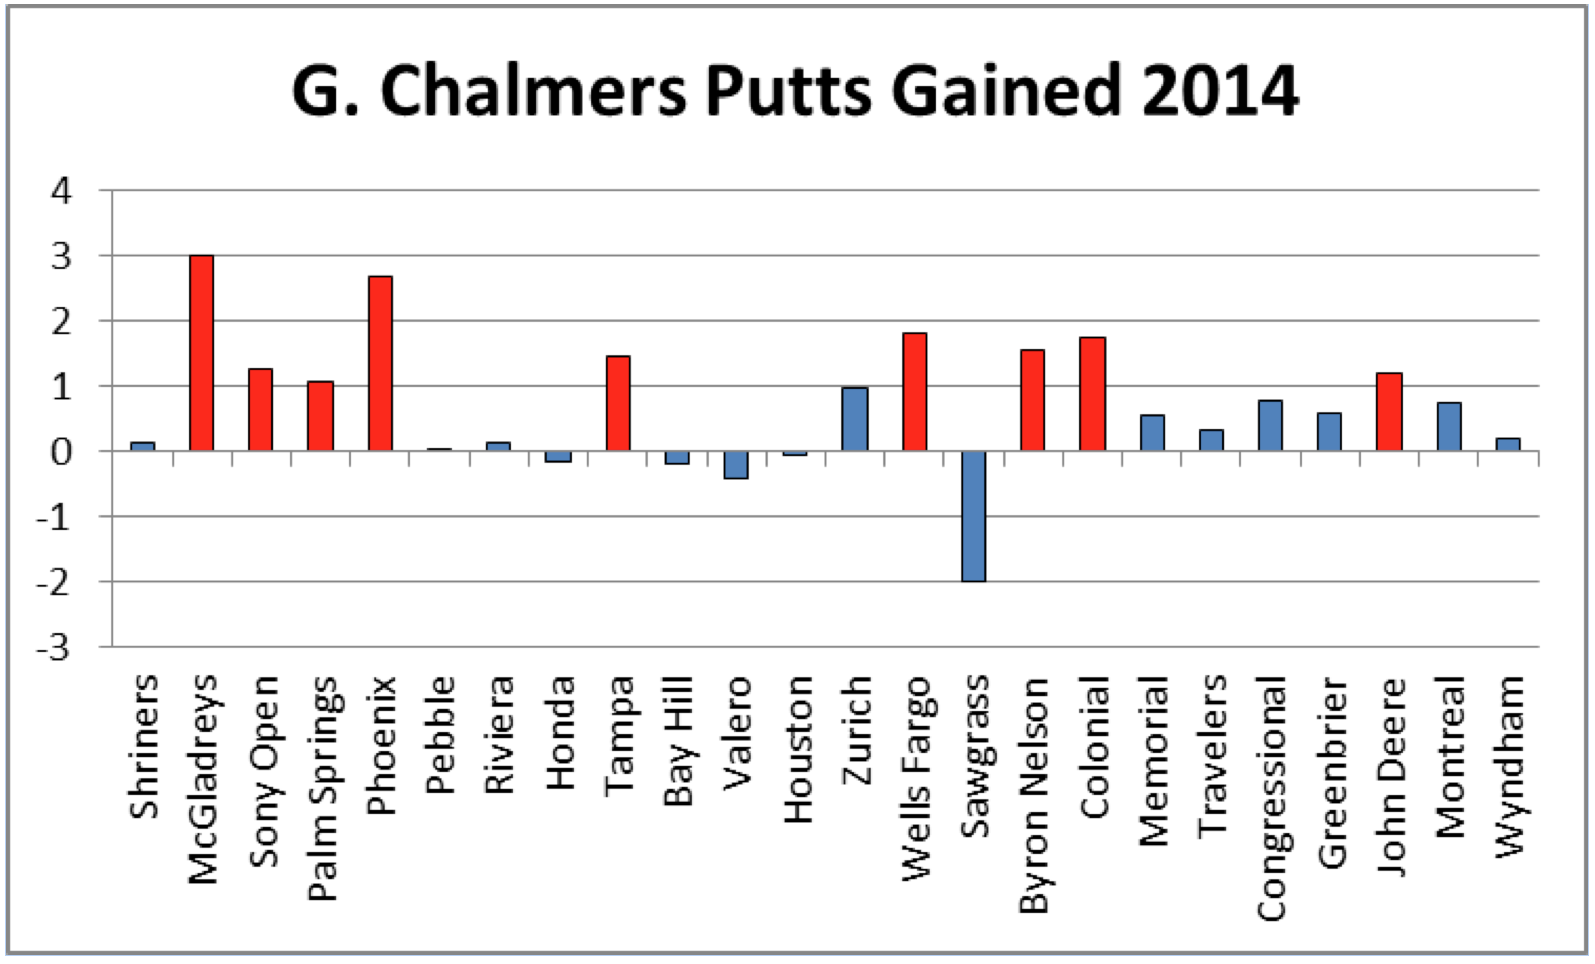
By looking at the graphs, we can see that great putting tends to occur at roughly the same time. Aaron Baddeley hit a stretch of great putting from The McGladreys through Riviera, as he putted great in 4 of those 6 events (notice the tall red bars, which indicate strokes gained on the field).
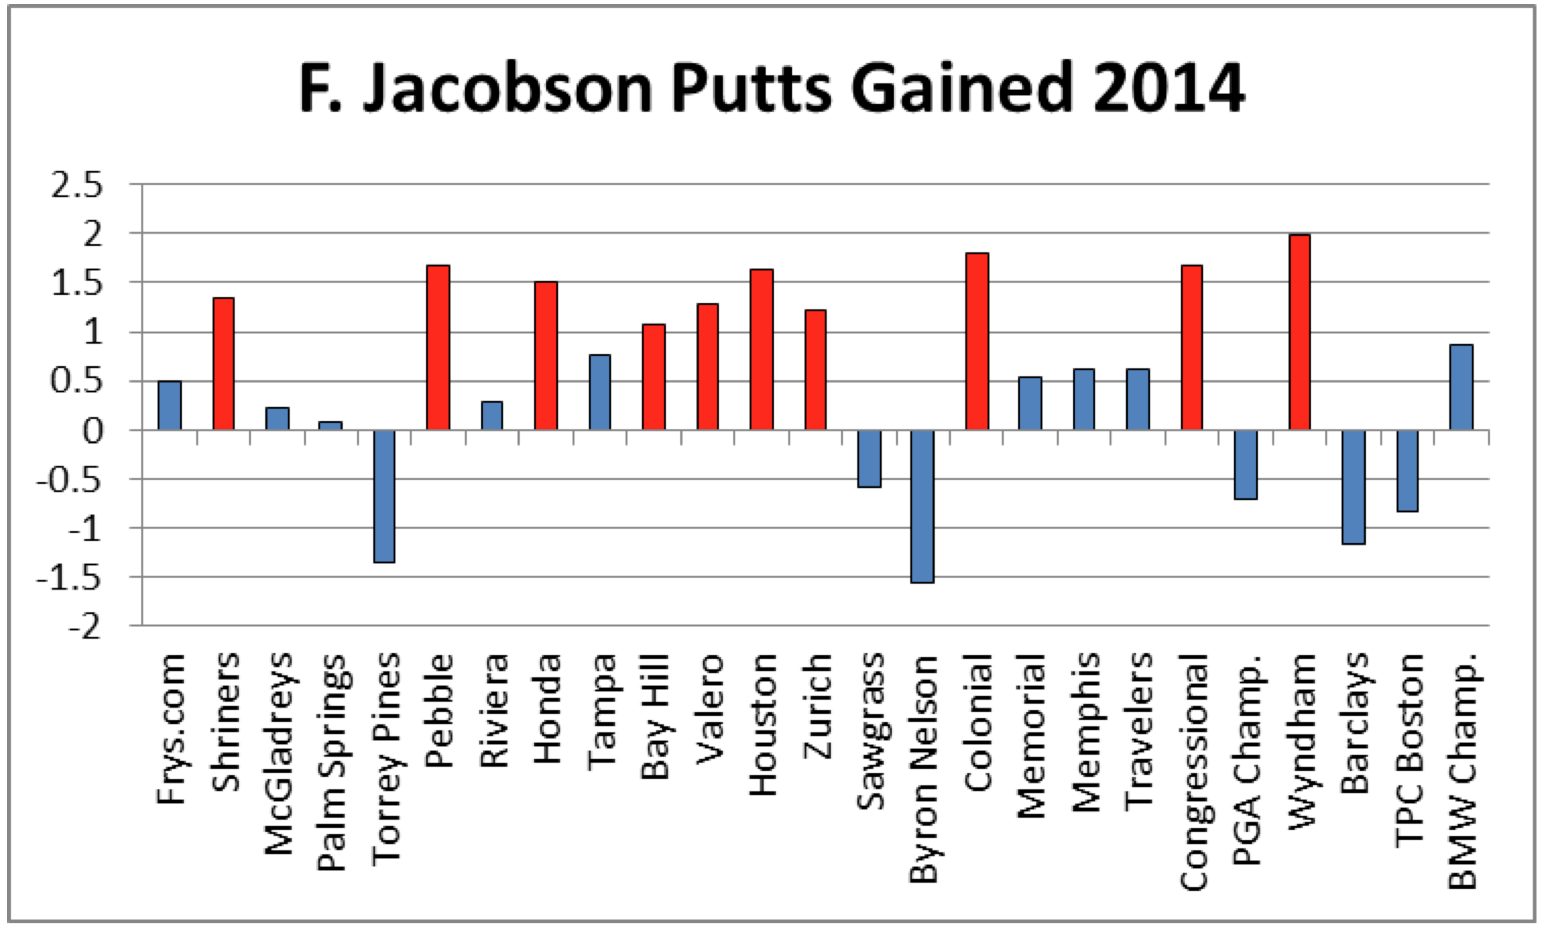
Freddie Jacobson hit his hot streak by putting great in 6 out of 8 events from Pebble Beach to the Zurich Classic. And Greg Chalmers started the year on fire by putting great in four events in a from The McGladreys to TPC Scottsdale.
Great putters also tend to cool off in streaks, however. They usually tend to putt better than the average (better than 0 strokes gained), but they can no longer rely on great putting for them to do well in a tournament. And that is where I believe why the average length of a player’s two-putts correlates strongest to Strokes Gained Putting.
But, I didn’t want to stop there. I wanted to look at a combination of metrics to help decide if there is more than one way to correlate to Strokes Gained Putting. And what I found was that if you combine the length of the average two putt along with the length of the average birdie putt made, you get the strongest correlation to Strokes Gained Putting in the end.
Let’s remember how Strokes Gained Putting is designed. If the field makes 40 percent of their putts from 10 feet, that will equate to roughly 1.6 strokes to the hole from 10 feet. If a player one-putts from 10 feet, then they are determined to have gained +0.6 strokes on the field. If they two-putt from 10 feet, then they have lost -0.4 strokes to the field.
The reason why birdie putts contribute to Strokes Gained Putting more is that they are by and large more difficult for players to make. In fact, only two PGA Tour players had a higher make percentage of birdie putts than par putts from 5-to-15 feet: Kevin Streelman and Luke Donald.
Anytime the make percentage goes down, there is more potential for a player to gain more strokes. If the make percentage from 10 feet went down to 20 percent and that roughly equates to 1.8 strokes from 10 feet, a player that makes the 10-foot putt now gains 0.8 strokes on the field.
Essentially, what this tells me is that even the best putters are not going to be able to take great putting from course to course, so they need to be two-putting when putts are not dropping for them. And when you combine the length of the two-putts along with the length of birdie putts made, it provides a measurement of ability to avoid three-putts and ability to make putts.
The average Tour player’s two-putt distance is roughly 22.5 feet, and their average birdie putt make distance is 10.5 feet. That comes to a combined 33 feet. I also wanted to test this with another metric that is fairly easy to measure: Greens in Regulation (GIR).
When combining GIR with the “Average All Two-Putts Distance” and the “Average Birdie Make Putt Distance,” it has an incredibly strong correlation to Adjusted Scoring Average.
Normally, I’m not a big fan of the greens in regulation metric due to its flaws and ambiguous nature, but considering that it is an easy metric to calculate and the correlation between greens hit and the two-putt and one-putt average distance is so high, I think it is a helpful way for a player to measure their skills.
And that’s how I came up with the “98 Score.”
Here are the Tour averages for each of the metrics:
- Average All 2-Putts Distance: 22.5 feet
- Average Birdie Putts Made Distance: 10.5 feet
- Average Greens In Regulation: 65 percent
22.5 + 10.5 + 65 = 98
If you can score 98 or better, than you are playing quite well. If not, keep trying to improve your score so you can get the ball on the green more often and putt better when you’re on the greens.
- LIKE69
- LEGIT10
- WOW8
- LOL2
- IDHT1
- FLOP11
- OB2
- SHANK7
19th Hole
Vincenzi’s LIV Golf Singapore betting preview: Course specialist ready to thrive once again

After another strong showing in Australia, LIV Golf will head to Sentosa Golf Club in Singapore looking to build off of what was undoubtedly their best event to date.
Sentosa Golf Club sits on the southern tip of Singapore and is one of the most beautiful courses in the world. The course is more than just incredible scenically; it was also rated 55th in Golf Digest’s top-100 courses in 2022-2023 and has been consistently regarded as one of the best courses in Asia. Prior to being part of the LIV rotation, the course hosted the Singapore Open every year since 2005.
Sentosa Golf Club is a par 71 measuring 7,406 yards. The course will require precise ball striking and some length off the tee. It’s possible to go low due to the pristine conditions, but there are also plenty of hazards and difficult spots on the course that can bring double bogey into play in a hurry. The Bermudagrass greens are perfectly manicured, and the course has spent millions on the sub-air system to keep the greens rolling fast. I spoke to Asian Tour player, Travis Smyth, who described the greens as “the best [he’s] ever played.”
Davis Love III, who competed in a Singapore Open in 2019, also gushed over the condition of the golf course.
“I love the greens. They are fabulous,” the 21-time PGA Tour winner said.
Love III also spoke about other aspects of the golf course.
“The greens are great; the fairways are perfect. It is a wonderful course, and it’s tricky off the tee.”
“It’s a long golf course, and you get some long iron shots. It takes somebody hitting it great to hit every green even though they are big.”
As Love III said, the course can be difficult off the tee due to the length of the course and the trouble looming around every corner. It will take a terrific ball striking week to win at Sentosa Golf Club.
In his pre-tournament press conference last season, Phil Mickelson echoed many of the same sentiments.
“To play Sentosa effectively, you’re going to have a lot of shots from 160 to 210, a lot of full 6-, 7-, 8-iron shots, and you need to hit those really well and you need to drive the ball well.”
Golfers who excel from tee to green and can dial in their longer irons will have a massive advantage this week.
Stat Leaders at LIV Golf Adelaide:
Fairways Hit
1.) Louis Oosthuizen
2.) Anirban Lahiri
3.) Jon Rahm
4.) Brendan Steele
5.) Cameron Tringale
Greens in Regulation
1.) Brooks Koepka
2.) Brendan Steele
3.) Dean Burmester
4.) Cameron Tringale
5.) Anirban Lahiri
Birdies Made
1.) Brendan Steele
2.) Dean Burmester
3.) Thomas Pieters
4.) Patrick Reed
5.) Carlos Ortiz
LIV Golf Individual Standings:
1.) Joaquin Niemann
2.) Jon Rahm
3.) Dean Burmester
4.) Louis Oosthuizen
5.) Abraham Ancer
LIV Golf Team Standings:
1.) Crushers
2.) Legion XIII
3.) Torque
4.) Stinger GC
5.) Ripper GC
LIV Golf Singapore Picks
Sergio Garcia +3000 (DraftKings)
Sergio Garcia is no stranger to Sentosa Golf Club. The Spaniard won the Singapore Open in 2018 by five strokes and lost in a playoff at LIV Singapore last year to scorching hot Talor Gooch. Looking at the course setup, it’s no surprise that a player like Sergio has played incredible golf here. He’s long off the tee and is one of the better long iron players in the world when he’s in form. Garcia is also statistically a much better putter on Bermudagrass than he is on other putting surfaces. He’s putt extremely well on Sentosa’s incredibly pure green complexes.
This season, Garcia has two runner-up finishes, both of them being playoff losses. Both El Camaleon and Doral are courses he’s had success at in his career. The Spaniard is a player who plays well at his tracks, and Sentosa is one of them. I believe Sergio will get himself in the mix this week. Hopefully the third time is a charm in Singapore.
Paul Casey +3300 (FanDuel)
Paul Casey is in the midst of one of his best seasons in the five years or so. The results recently have been up and down, but he’s shown that when he’s on a golf course that suits his game, he’s amongst the contenders.
This season, Casey has finishes of T5 (LIV Las Vegas), T2 (LIV Hong Kong), and a 6th at the Singapore Classic on the DP World Tour. At his best, the Englishman is one of the best long iron players in the world, which makes him a strong fit for Sentosa. Despite being in poor form last season, he was able to fire a Sunday 63, which shows he can low here at the course.
It’s been three years since Casey has won a tournament (Omega Dubai Desert Classic in 2021), but he’s been one of the top players on LIV this season and I think he can get it done at some point this season.
Mito Pereira +5000 (Bet365)
Since Mito Pereira’s unfortunate demise at the 2022 PGA Championship, he’s been extremely inconsistent. However, over the past few months, the Chilean has played well on the International Series as well as his most recent LIV start. Mito finished 8th at LIV Adelaide, which was his best LIV finish this season.
Last year, Pereira finished 5th at LIV Singapore, shooting fantastic rounds of 67-66-66. It makes sense why Mito would like Sentosa, as preeminent ball strikers tend to rise to the challenge of the golf course. He’s a great long iron player who is long and straight off the tee.
Mito has some experience playing in Asia and is one of the most talented players on LIV who’s yet to get in the winner’s circle. I have questions about whether or not he can come through once in contention, but if he gets there, I’m happy to roll the dice.
Andy Ogletree +15000 (DraftKings)
Andy Ogletree is a player I expected to have a strong 2024 but struggled early in his first full season on LIV. After failing to crack the top-25 in any LIV event this year, the former U.S. Amateur champion finally figured things out, finished in a tie for 3rd at LIV Adelaide.
Ogletree should be incredible comfortable playing in Singapore. He won the International Series Qatar last year and finished T3 at the International Series Singapore. The 26-year-old was arguably the best player on the Asian Tour in 2023 and has been fantastic in the continent over the past 18 months.
If Ogletree has indeed found form, he looks to be an amazing value at triple-digit odds.
- LIKE3
- LEGIT3
- WOW1
- LOL2
- IDHT0
- FLOP2
- OB0
- SHANK0
In Tampa, there is a golf course that boasts carts that do not work, a water range, and a group of players none of which have any chance to break 80. The course is overseen by a staff of crusty men who have succeeded at nothing in life but ending up at the worst-run course in America. However, this place is no failure. With several other local courses going out of business — and boasting outstanding greens — the place is booked full.
While I came for the great greens, I stayed to watch our resident instructor; a poor-tempered, method teacher who caters to the hopeless. At first, it was simply hilarious. However, after months of listening and watching, something clicked. I realized I had a front-row seat to the worst golf instructor in America.
Here are some of my key takeaways.
Method Teacher
It is widely accepted that there are three types of golf instructors: system teachers, non-system teachers, and method teachers. Method teachers prescribe the same antidote for each student based on a preamble which teachers can learn in a couple day certification.
Method teaching allows anyone to be certified. This process caters to the lowest caliber instructor, creating the illusion of competency. This empowers these underqualified instructors with the moniker of “certified” to prey on the innocent and uninformed.
The Cult of Stack and Jilt
The Stack and Tilt website proudly boasts, “A golfer swings his hands inward in the backswing as opposed to straight back to 1) create power, similar to a field goal kicker moving his leg in an arc and 2) to promote a swing that is in-to-out, which produces a draw (and eliminates a slice).”
Now, let me tell you something, there is this law of the universe which says “energy can either be created or destroyed,” so either these guys are defying physics or they have no idea what they are taking about. Further, the idea that the first move of the backswing determines impact is conjecture with a splash of utter fantasy.
These are the pontifications of a method — a set of prescriptions applied to everyone with the hope of some success through the placebo effect. It is one thing for a naive student to believe, for a golf instructor to drink and then dispel this Kool-Aid is malpractice.
Fooled by Randomness
In flipping a coin, or even a March Madness bet, there is a 50-50 chance of success. In golf, especially for new players, results are asymmetric. Simply put: Anything can happen. The problem is that when bad instructors work with high handicappers, each and every shot gets its own diagnosis and prescription. Soon the student is overwhelmed.
Now here’s the sinister thing: The overwhelming information is by design. In this case, the coach is not trying to make you better, they are trying to make you reliant on them for information. A quasi Stockholm syndrome of codependency.
Practice
One of the most important scientists of the 20th century was Ivan Pavlov. As you might recall, he found that animals, including humans, could be conditioned into biological responses. In golf, the idea of practice has made millions of hackers salivate that they are one lesson or practice session from “the secret.”
Sunk Cost
The idea for the worst golf instructor is to create control and dependency so that clients ignore the sunk cost of not getting better. Instead, they are held hostage by the idea that they are one lesson or tip away from unlocking their potential.
Cliches
Cliches have the effect of terminating thoughts. However, they are the weapon of choice for this instructor. Add some hyperbole and students actually get no information. As a result, these players couldn’t play golf. When they did, they had no real scheme. With no idea what they are doing, they would descend into a spiral of no idea what to do, bad results, lower confidence, and running back to the lesson tee from more cliches.
The fact is that poor instruction is about conditioning players to become reliant members of your cult. To take away autonomy. To use practice as a form of control. To sell more golf lessons not by making people better but through the guise that without the teacher, the student can never reach their full potential. All under the umbrella of being “certified” (in a 2-day course!) and a melee of cliches.
This of course is not just happening at my muni but is a systemic problem around the country and around the world, the consequences of which are giving people a great reason to stop playing golf. But hey, at least it’s selling a lot of golf balls…
- LIKE17
- LEGIT2
- WOW0
- LOL4
- IDHT1
- FLOP1
- OB0
- SHANK19

The PGA TOUR heads to New Orleans to play the 2023 Zurich Classic of New Orleans. In a welcome change from the usual stroke play, the Zurich Classic is a team event. On Thursday and Saturday, the teams play best ball, and on Friday and Sunday the teams play alternate shot.
TPC Louisiana is a par 72 that measures 7,425 yards. The course features some short par 4s and plenty of water and bunkers, which makes for a lot of exciting risk/reward scenarios for competitors. Pete Dye designed the course in 2004 specifically for the Zurich Classic, although the event didn’t make its debut until 2007 because of Hurricane Katrina.
Coming off of the Masters and a signature event in consecutive weeks, the field this week is a step down, and understandably so. Many of the world’s top players will be using this time to rest after a busy stretch.
However, there are some interesting teams this season with some stars making surprise appearances in the team event. Some notable teams include Patrick Cantlay and Xander Schauffele, Rory McIlroy and Shane Lowry, Collin Morikawa and Kurt Kitayama, Will Zalatoris and Sahith Theegala as well as a few Canadian teams, Nick Taylor and Adam Hadwin and Taylor Pendrith and Corey Conners.
Past Winners at TPC Louisiana
- 2023: Riley/Hardy (-30)
- 2022: Cantlay/Schauffele (-29)
- 2021: Leishman/Smith (-20)
- 2019: Palmer/Rahm (-26)
- 2018: Horschel/Piercy (-22)
- 2017: Blixt/Smith (-27)
2024 Zurich Classic of New Orleans Picks
Tom Hoge/Maverick McNealy +2500 (DraftKings)
Tom Hoge is coming off of a solid T18 finish at the RBC Heritage and finished T13 at last year’s Zurich Classic alongside Harris English.
This season, Hoge is having one of his best years on Tour in terms of Strokes Gained: Approach. In his last 24 rounds, the only player to top him on the category is Scottie Scheffler. Hoge has been solid on Pete Dye designs, ranking 28th in the field over his past 36 rounds.
McNealy is also having a solid season. He’s finished T6 at the Waste Management Phoenix Open and T9 at the PLAYERS Championship. He recently started working with world renowned swing coach, Butch Harmon, and its seemingly paid dividends in 2024.
Keith Mitchell/Joel Dahmen +4000 (DraftKings)
Keith Mitchell is having a fantastic season, finishing in the top-20 of five of his past seven starts on Tour. Most recently, Mitchell finished T14 at the Valero Texas Open and gained a whopping 6.0 strokes off the tee. He finished 6th at last year’s Zurich Classic.
Joel Dahmen is having a resurgent year and has been dialed in with his irons. He also has a T11 finish at the PLAYERS Championship at TPC Sawgrass which is another Pete Dye track. With Mitchell’s length and Dahmen’s ability to put it close with his short irons, the Mitchell/Dahmen combination will be dangerous this week.
Taylor Moore/Matt NeSmith +6500 (DraftKings)
Taylor Moore has quickly developed into one of the more consistent players on Tour. He’s finished in the top-20 in three of his past four starts, including a very impressive showing at The Masters, finishing T20. He’s also finished T4 at this event in consecutive seasons alongside Matt NeSmith.
NeSmith isn’t having a great 2024, but has seemed to elevate his game in this format. He finished T26 at Pete Dye’s TPC Sawgrass, which gives the 30-year-old something to build off of. NeSmith is also a great putter on Bermudagrass, which could help elevate Moore’s ball striking prowess.
- LIKE8
- LEGIT3
- WOW1
- LOL1
- IDHT0
- FLOP3
- OB1
- SHANK2


Dave Portnoy places monstrous outright bet for the 2024 Masters

John Daly stuns fans into silence with brutal opening tee shot on PGA Tour Champions

Things got heated at the Houston Open between Tony Finau and Alejandro Tosti. Here’s why

Justin Thomas on the equipment choice of Scottie Scheffler that he thinks is ‘weird’

Tiger Woods arrives at 2024 Masters equipped with a putter that may surprise you

‘Absolutely crazy’ – Major champ lays into Patrick Cantlay over his decision on final hole of RBC Heritage

Report: Tiger Woods has ‘eliminated sex’ in preparation for the 2024 Masters

Two star names reportedly blanked Jon Rahm all week at the Masters

2-time major champ announces shock retirement from the sport at age of 33

Report: LIV Golf identifies latest star name they hope to sign to breakaway tour

Kris Kim WITB 2024 (May)
Kris Kim what’s in the bag accurate as of the CJ Cup Byron Nelson. More photos from the event here....

Richy Werenski WITB 2024 (May)
Richy Werenski what’s in the bag accurate as of the CJ Cup Houston Open. Driver: Titleist TSR3 (10 degrees, D1...

Wesley Bryan WITB 2024 (May)
Wesley Bryan what’s in the bag accurate as of the CJ Cup Byron Nelson. Driver: Callaway Paradym Ai Smoke Triple...

Adam Scott WITB 2024 (May)
Adam Scott what’s in the bag accurate as of the 2024 CJ Cup Byron Nelson. Driver: TaylorMade Qi10 (10.5 degrees)...
-
 19th Hole2 weeks ago
Justin Thomas on the equipment choice of Scottie Scheffler that he thinks is ‘weird’
-
 19th Hole2 weeks ago
‘Absolutely crazy’ – Major champ lays into Patrick Cantlay over his decision on final hole of RBC Heritage
-
 19th Hole3 weeks ago
Two star names reportedly blanked Jon Rahm all week at the Masters
-
 19th Hole3 weeks ago
Report: LIV Golf identifies latest star name they hope to sign to breakaway tour
-
 19th Hole3 weeks ago
Neal Shipley presser ends in awkward fashion after reporter claims Tiger handed him note on 8th fairway
-
 19th Hole2 weeks ago
Brandel Chamblee has ‘no doubt’ who started the McIlroy/LIV rumor and why
-
 19th Hole1 week ago
LET pro gives detailed financial breakdown of first week on tour…and the net result may shock you
-
 Equipment2 weeks ago
Jason Day on his recent switch into Srixon ZX5 and ZX7 Mk II irons
Trae
Feb 12, 2015 at 7:44 pm
This was a good read, and very interesting. And it brings back memories of stats class, and also me spending countless hours entering in data from the pga tour just to see relationships between variables and trying to create a number of statistical models to predict, etc. I’m never doing that again! Never got to a point where I could really apply it to my own game in a really effective way though. Always would end up getting caught up in trying to figure out why someone was an outlier, then later on lost interest in stats altogether. It’s interesting stuff but I think it can be very misleading in some cases. It can be tricky. Anyways, I enjoyed this article and I’m looking forward to your next one. Thanks.
Jeff Watson
Feb 11, 2015 at 4:32 pm
Rich,
I like it. I already pace off my putts and number of putts for a stats program I subscribe to. Any idea what the “Score” would be based on handicap?
Jeff
david
Feb 11, 2015 at 12:54 pm
Hi Ritch, I had to drop out of gread 11 math, so unfortunately my brain is still bleeding after reading your article. I know the tour putting stats on makeability is, from what I believe, from 6 feet to about 50%. I was a bit under this, so I worked hard on my putting last summer and lowered my cap from aprox 5 to 3.7. I know without keeping stats that not enough of my greenside chips get to inside 4 feet, so that is my focus this summer to knock off another 2 points. But I did find the article interesting, but not necessarily relevant to most amateurs, whatever the index.
Dick Kusleika
Feb 11, 2015 at 11:13 am
I step off every first putt. I don’t know how people putt without stepping it off. They just guess or try to feel it, I suppose.
I think the negative correlation is “inverse relationship”, not “indirect relationship”.
Hudson
Feb 10, 2015 at 2:21 pm
I calculate the strokes gained (lost in my case, lol) and measure one pace (3 feet) to get the distance on the green from the pin. It takes a few seconds and it’s dead easy.
I am going full speed to track/calculate my strokes gained now and I am explaining it there:
http://golf-made-in-us.blogspot.com/2014/04/golf-stats-revolution-gained-strokes.html
I consequently discovered that I was losing 6 strokes between 125 and 200 yards (on a 14 hcp) on average in 2014 and will work on that !
Rich Hunt
Feb 10, 2015 at 2:35 pm
Hudson, I’ve enjoyed your work. The only issue I have with using strokes gained with putting is that the make %’s at a local course are likely different then at a Tour level course, even for Tour players. As we’ve seen time and time again, slower greens mean lower make %’s for players across the board. I’ve not only seen it at Tour courses that I record the data for, but David Orr did a study on this and found the same thing as well. IMO, it is probably best to use strokes gained in comparing it to your own performance over time and see how well you improve or regress.
HIGHfader
Feb 10, 2015 at 4:49 pm
Richie, do you know where I can find that David Orr studdy?
Richie Hunt
Feb 10, 2015 at 8:13 pm
I don’t believe David has made it public. But, if you asked him that is what he would tell you. IIRC, they measured roughly 700 golfers and were on greens from the local muni to Pinehurst.
jeff
Feb 10, 2015 at 1:23 pm
Rich, great writeup, thanks. But without data from our peers (“the field”), how is this different from simply looking at your actual score for the round as a basis for judging our “getting better”? What I mean is, what will achieving a 98 in this fashion tell us about our game that the score cannot? If the result of putting better (fewer putts per round) is a better overall score, isn’t that pretty much the same thing? Without a field to compare against, how much would we actually get out of this? Thanks again!
Rich Hunt
Feb 10, 2015 at 2:18 pm
Jeff,
Very good point. I think we can use the 98 Score to measure how well we are striking the ball and putting. So the other factors that would cause a discrepancy in 98 Score versus Actual Score would be short game shots around the green, penalty shots and general strategy. So if the score is better than 98, but a player shoots 75, then they may have struggled with short game or hit a shot OB or in the drink.
In my next article I will go into simple metrics I keep for my rounds that will better help determine the strengths and weaknesses of our game.
myron miller
Feb 10, 2015 at 12:40 pm
I’m a little sceptical of your usage of the statistical correlation coefficient. Famous statistical anolmaly: Amount of ice cream eaten versus number of polio cases was fantastically high (close to .9 or something like that). Ergo if you eat a lot of Ice cream your chances of polio increased. Just because there’s a correlation doesn’t mean that there is necessarily a relationship. Usually but not necessarily. Other factors could be involved that sway the correlation coefficient.
For the amateur to actually pace off every putt regardless does help but slows down the game a bit increasing the time for the round. Not a productive way to help the overall pace of play but it does help the individual golfer (assuming his paces are moderately accurate – which is sometimes questionable). So which is more important, pace of play or helping the individual in play? At which time?
Rich Hunt
Feb 10, 2015 at 2:14 pm
Correlation does not imply causality (unless there is a correlation of a perfect +1 or -1). The issue is that people tend to take that the wrong way as correlation is trying to define the symmetry of a relationship.
The problem with the ice cream to polio correlation is that usually those types of analysis are done over a very short period of time so the sample size is not large enough. The other issue is that the variables (polio and ice cream consumption) have virtually nothing to do with each other.
Correlation is not about certainty, it’s about probability. The real issue with the correlations I used is that they are not ‘strong correlations’ (+0.5 or better), so the 1:1 relationship is not exactly a confident one. But, that could be due to a myriad of factors like a golfer’s ballstriking.
However, those correlations were fairly consistent over the seasons and on a comparative basis I think it indicates that all 2-putts length does give a better indication of how a player is putting than say 3-putt length. And given that when we combine all 2-putts and birdie putts lengths does have a strong correlation, it’s a good way to measure our true putting prowess.
Lastly, the main point of the article was to more accurately measure our own putting prowess and do it without the measuring process being too cumbersome and time consuming. Obviously, we don’t know how well we are putting versus other golfers. But we can measure our own improvement over time with a large enough sample by seeing how well we improve compared to our performance in other rounds of golf.
Rich Hunt
Feb 10, 2015 at 2:28 pm
Myron,
Correlation does not imply causality (unless the correlation is +1 or -1). However, many people don’t quite understand that phrase as used in the polio to ice cream consumption case.
Correlation is designed to give a confidence level of the symmetrical relationship between 2 variables. For instance, we may see a correlation between ball speed and distance a ball travels of +0.9. That doesn’t consider launch angle, spin rate, landing angle of the ball, etc. But we have a high degree of confidence that ball speed will be a large determining factor in the distance the ball traveled.
The problem with using the polio to ice cream consumption argument (and the countless other arguments) is that:
1) typically the sample sizes are incredibly small so the data can be easily skewed.
2) the variables have virtually nothing to do with each other.
I feel the sample size of length of putt to putts gained is more than sufficient as it took place over several seasons with roughly 180 golfers per season. I also feel that the variables (length of a putt versus putts gained) are closely tied together.
If there is a an issue with using the correlations is that none of these correlations were ‘strong’ (+0.5 or better). However, if you add all 2-putt length and birdie putt lengths, the correlation is strong.
So, why is the correlation not at a perfect +1?
Likely due to ballstriking. If a player hits a birdie putt to 4-feet and make the birdie putt, there’s not much they can do about it rather than the player that misses their 4-foot birdie putts, but makes a 20-footer. The same goes for 2-putting.
Still, the main purpose of the article was to more easily determine how well you are putting and trying to improve upon your own performance. I think if one records this data over time they can use it to better gauge how well they have putted over a certain amount of time.
Rob Rashell
Feb 10, 2015 at 11:30 am
Rich,
This stuff is fantastic, will be sharing with the players I work with.
Rob
Rich Hunt
Feb 10, 2015 at 10:42 am
Steven,
I would just recommend pacing off the initial putt. I personally pace off all of my putts except for putts inside 5-feet since I know how long they are by eye-balling it.
It doesn’t have to be a perfect measurement because the idea is to improve your score so you can improve your putting. For instance, if you average 30-feet on your 2-putts by pacing it off and in reality it is 32 feet, that’s not as important as actually improving your 2-putt average the next time you play.
steven
Feb 10, 2015 at 10:24 am
rich, how would you recommend us amateurs determine the distance of our 2 putt distances. As well our birdie putt distances. Of course theres no guarantee i make a birdie in a round of golf. but i sure as heck attempt and make a lot of 2 putts. without the use of a simulator, ill simply be estimating the distance i am away from the hole. thus limiting the reliability of an amateurs usage of your ’98’ theory. any tips? as the concept seems very well thought out, but the execution for an average player is really implausible. thanks.