Opinion & Analysis
Understanding distance variance
Sometimes it can be a blow to the ego to go to a new course where the ball seems to go nowhere and you just can’t bring yourself to hit 5-iron, for example, when you could normally hit 7-iron.
But if you want to score well, it’s something that can be important to understand and accept…that is, that distances can vary quite dramatically from course to course.
To illustrate this, let’s take a look at the average driving distances for the field in the following PGA Tour and European Tour events from 2012.
2013 Average PGA & European PGA Tour Driving Distances by Event
| Event | Distance |
| DP World Tour Championship | 248.5 |
| Volvo Golf Championships | 252.1 |
| Hyundai Tournament of Champions | 270.4 |
| Reale Seguros Open de Espana | 270.4 |
| RBC Heritage | 277.8 |
| The Irish Open | 277.8 |
| Omega Dubai Desert Classic | 280.3 |
| Ballantine’s Championship | 281.3 |
| Transitions Championship | 281.5 |
| Maybank Malaysian Open | 281.6 |
| Frys.com Open | 281.8 |
| UBS Hong Kong Open | 282.3 |
| Aberdeen Asset Management Open | 282.9 |
| Nordea Masters | 283.2 |
| Africa Open | 283.4 |
| BMW International Open | 283.9 |
| Omega European Masters | 284.0 |
| Barclays Singapore Open | 284.5 |
| Johnnie Walker Championship | 284.9 |
| Lyoness Open | 285.0 |
| Alstom Open de France | 285.4 |
| Valero Texas Open | 285.9 |
| KLM Open | 286.1 |
| Abu Dhabi HSBC Championship | 286.8 |
| ISPS Honda Wales Open | 287.3 |
| BMW Masters | 287.9 |
| BMW Championship | 288.5 |
| Commercialbank Qatar Masters | 288.5 |
| Volvo China Open | 288.6 |
| Zurich Classic of New Orleans | 289.9 |
| BMW Italian Open | 290.3 |
| Joburg Open | 291.3 |
| Open de Andalucia | 291.4 |
| Deutsche Bank Championship | 292.6 |
| Portugal Masters | 293.3 |
| Crown Plaza Invitational at Colonial | 294.2 |
| Avantha Masters | 295.5 |
| John Deere Classic | 295.7 |
| Saint-Omer Open | 295.9 |
| Tour Championship | 297.4 |
| Sony Open in Hawaii | 297.5 |
| AT&T National | 297.9 |
| Sicilian Open | 298.3 |
| Wyndham Championship | 299.1 |
| HP Byron Nelson Championship | 300.4 |
| Justin Timberlak Shriners Hospital for Children Open | 305.7 |
| Reno-Tahoe Open | 311.6 |
| SA Open Championship | 313.6 |
| Madeira Islands Open | 322.6 |
Average: 288.5 yards/drive
Click here for more discussion in the “Instruction & Academy” forum.
As you can see, despite more or less the same players playing each week, there’s a 74.1-yard variance between the tournaments with the shortest and longest average driving distance for the field. That’s a huge difference!
It’s feasible that there were extenuating circumstances taking place during the events on the extreme ends causing such a broad gap. There may have been severe weather, for example, or perhaps a certain course required the use of more woods, hybrids, or irons off the tee. But in general, to account for things like this, the driving distance averages for Tour events are generally taken on two holes where the wind blows in opposite directions and also where the players are likely to use driver.
Even still, let’s take out a few of the extremes on the short and long ends. When we do this, note that the bulk of the average driving distances range between 280 and 300 yards. That’s still a 20-yard difference from event to event and course to course. It’s not as much as 74.1-yards but it’s still worth noting.
I remember this was also the case when I used to compete in long drive. My longest drive in competition was a 421-yard drive in Warner Springs, Calif., to win a qualifier for the RE/MAX World Long Drive Championships. Granted, it set the grid record but it was still on firm ground at an elevation of about 3,130 feet. Conversely, the 381-yard ball I hit to win the Pinnacle Distance Challenge was actually a much better drive, despite being 40 yards shorter. However, the ground was a little softer and the elevation was much less — around 466 feet.
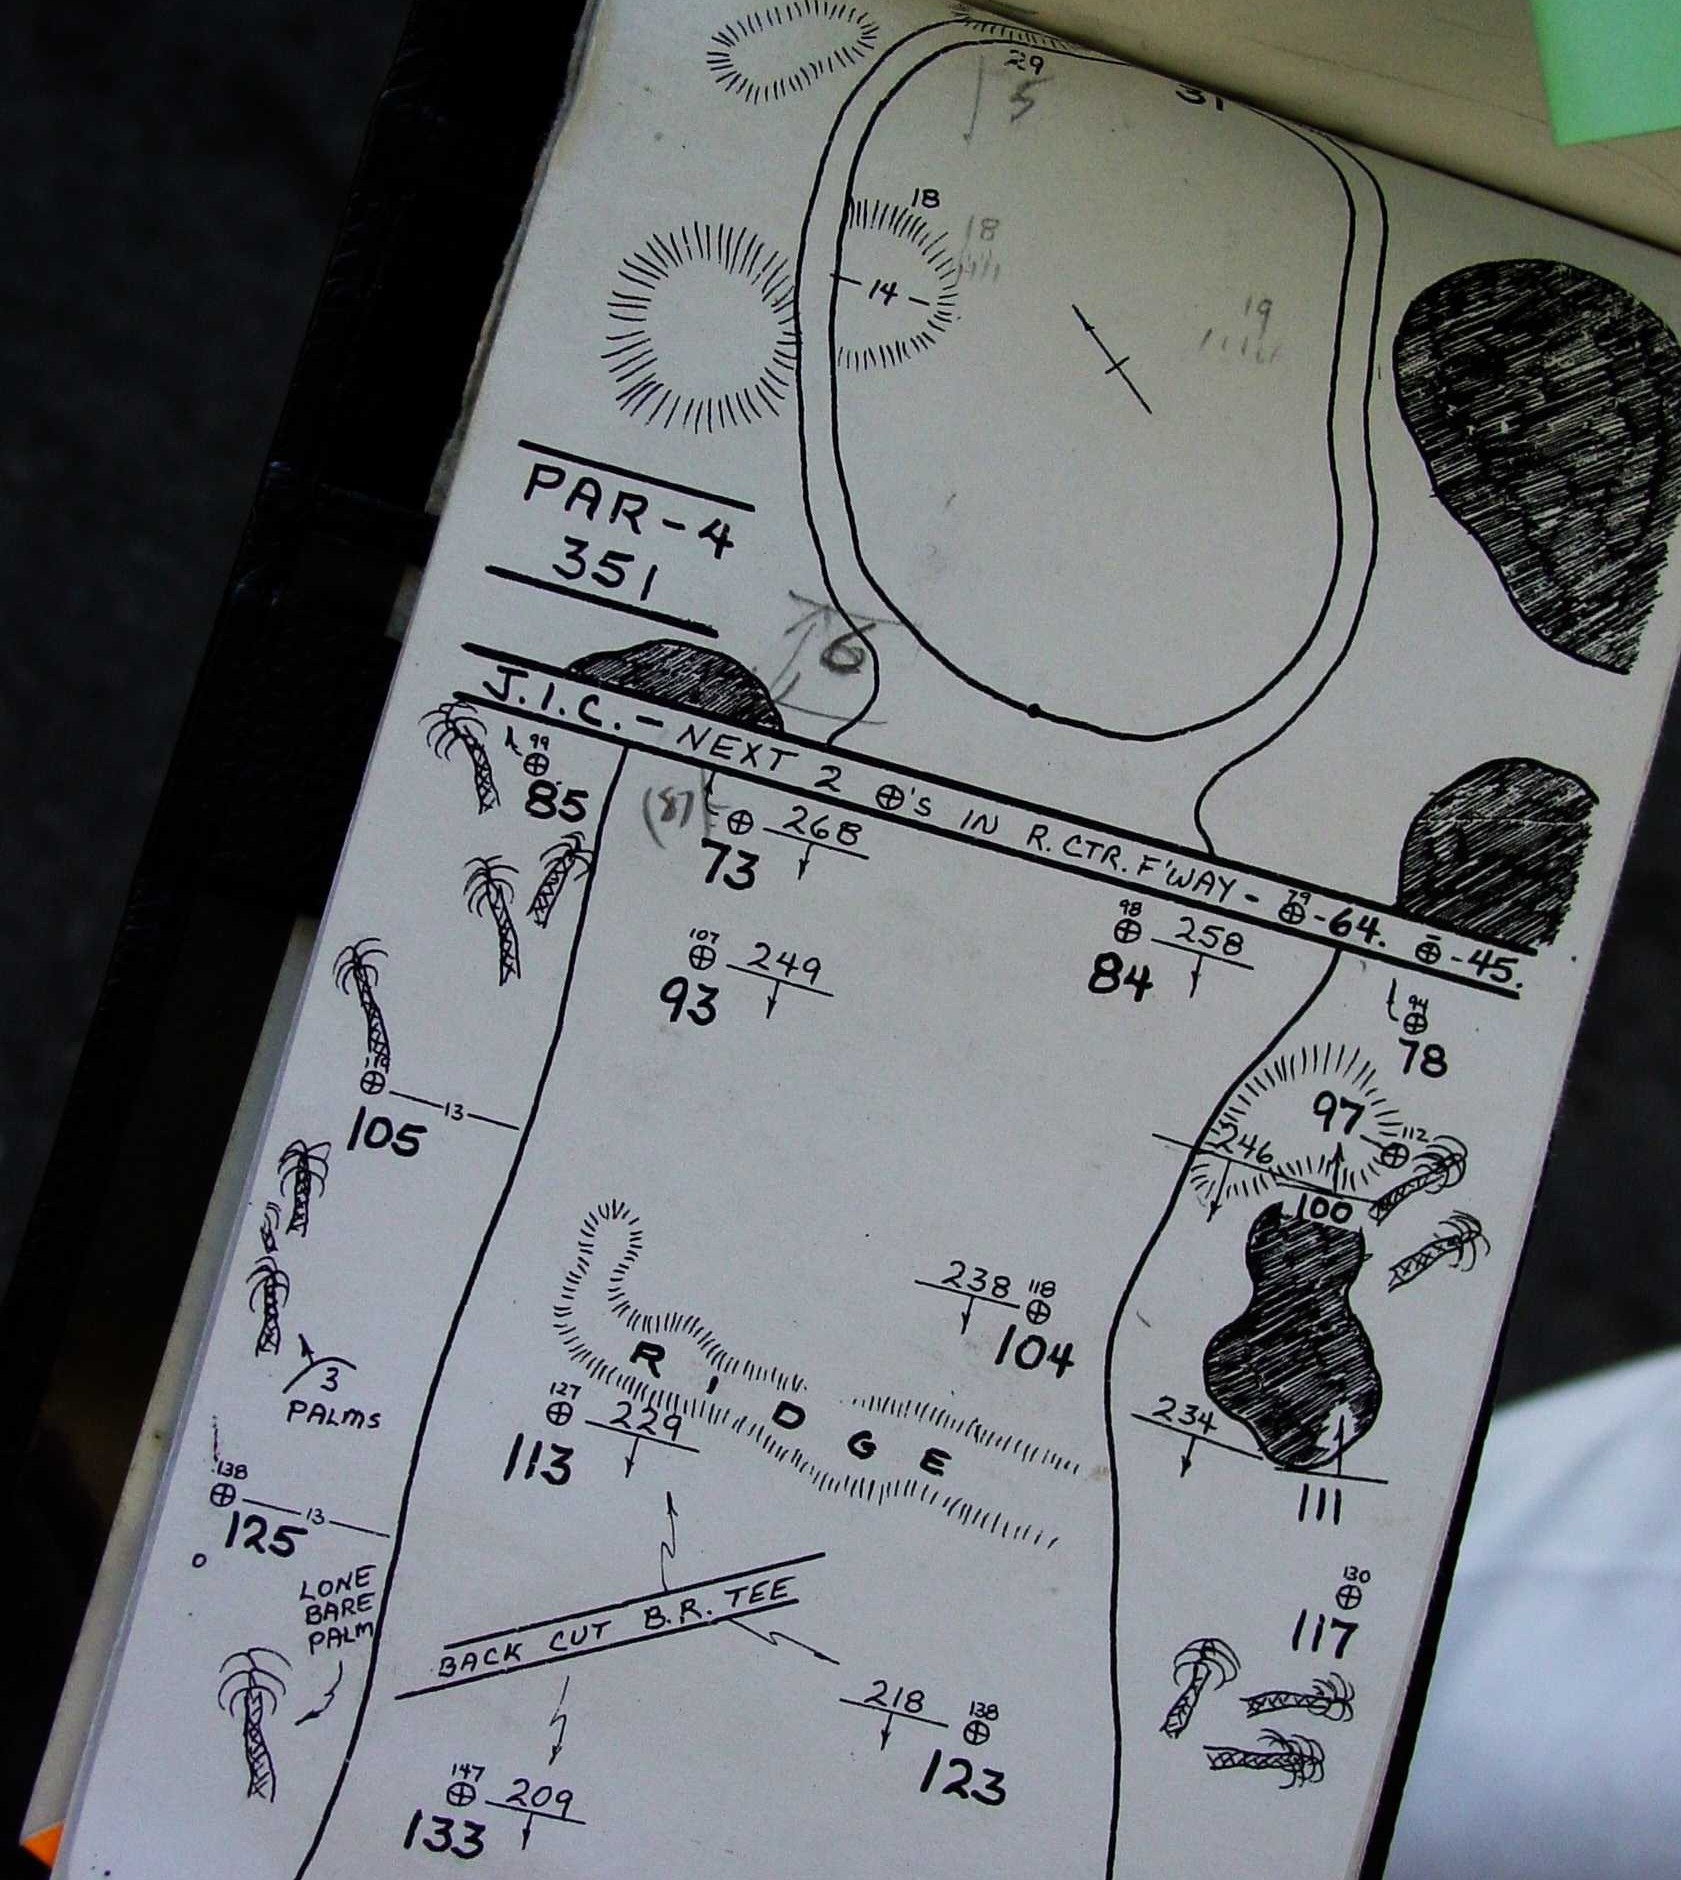
In general, Tour players and their caddies understand and are good at accepting that distances change based on conditions. In fact, determining these distance variances are actually one thing that many of them are doing during practice rounds…and it’s also partially why they can subsequently go tear up the course in the tournament with a few as one practice round under their belts.
Different guys do it differently, but in the 30-or-so week-long professional tournaments I’ve played, one of the things I’ll do during my practice round is jot down in my course guide or on a scorecard how far my clubs are going on full swings. By the end of the round, I’ll approximate the percent difference from my normal distances and then make a new distance card that I keep with me for reference during the tournament.
For example, let’s say these are my average carry distances (pros are more concerned with carry than total distance) for my clubs on flat ground under normal conditions:
| Club | Carry |
| Driver | 270 |
| 3-Wood | 243 |
| 16* Hybrid | 225 |
| 20* Hybrid | 212 |
| 4-Iron | 203 |
| 5-Iron | 194 |
| 6-Iron | 183 |
| 7-Iron | 172 |
| 8-Iron | 160 |
| 9-Iron | 148 |
| PW | 136 |
Then, over the course of my practice round, I find out that on average I’m about 3 percent longer with each club at this new course I’m playing. So I get out my calculator, add 3 percent, and then make a small card like this to carry with me for reference during the rest of the tournament: Personally, I like having a little card like this because it saves me both time in determining what shot I want to hit and also mental energy during the tournament rounds.
| Club | Carry |
| Driver | 278 |
| 3-Wood | 250 |
| 16* Hybrid | 232 |
| 20* Hybrid | 218 |
| 4-Iron | 209 |
| 5-Iron | 200 |
| 6-Iron | 188 |
| 7-Iron | 177 |
| 8-Iron | 165 |
| 9-Iron | 152 |
| PW | 140 |
Note that on the updated card it’s only about a 4-yard variation for the PW, but that could mean the difference between having a 3-footer for birdie or a 15-footer. With the driver, the 8-yards of extra carry might give me the confidence to fly over a fairway bunker I normally wouldn’t otherwise try to carry.
You may not want to get in to this level of detail with your own game (or have the ball-striking skill to worry about it – hehe), but I guess the point I’m getting at is to keep in mind that depending on the course you play and the conditions involved, distances can and will vary.
Understanding and accepting this can help you make better club selections in general, which of course can also lead to lower scores.
Click here for more discussion in the “Instruction & Academy” forum.
- LIKE21
- LEGIT2
- WOW1
- LOL0
- IDHT0
- FLOP1
- OB0
- SHANK1
My golf learning began with this simple fact – if you don’t have a fundamentally sound hold on the golf club, it is practically impossible for your body to execute a fundamentally sound golf swing. I’m still a big believer that the golf swing is much easier to execute if you begin with the proper hold on the club.
As you might imagine, I come into contact with hundreds of golfers of all skill levels. And it is very rare to see a good player with a bad hold on the golf club. There are some exceptions, for sure, but they are very few and very far between, and they typically have beat so many balls with their poor grip that they’ve found a way to work around it.
The reality of biophysics is that the body moves only in certain ways – and the particulars of the way you hold the golf club can totally prevent a sound swing motion that allows the club to release properly through the impact zone. The wonderful thing is that anyone can learn how to put a fundamentally sound hold on the golf club, and you can practice it anywhere your hands are not otherwise engaged, like watching TV or just sitting and relaxing.
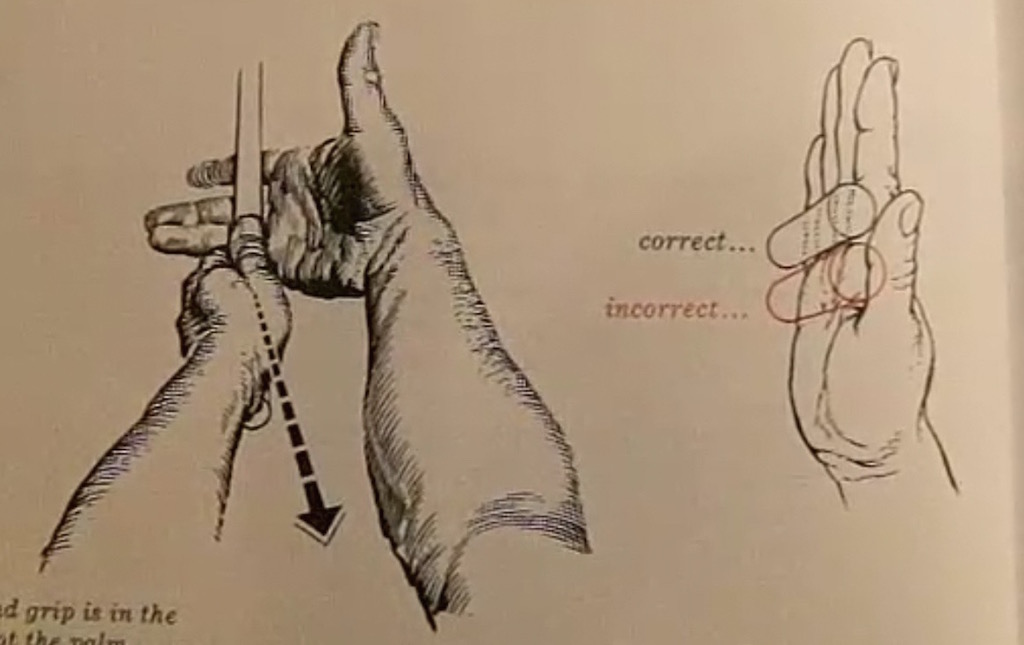
Whether you prefer an overlap, interlock or full-finger (not baseball!) grip on the club, the same fundamentals apply. Here are the major grip faults I see most often, in the order of the frequency:
Mis-aligned hands
By this I mean that the palms of the two hands are not parallel to each other. Too many golfers have a weak left hand and strong right, or vice versa. The easiest way to learn how to hold the club with your palms aligned properly is to grip a plain wooden ruler or yardstick. It forces the hands to align properly and shows you how that feels. If you grip and re-grip a yardstick several times, then grip a club, you’ll see that the learning curve is almost immediate.
The position of the grip in the upper/left hand
I also observe many golfers who have the butt of the grip too far into the heel pad of the upper hand (the left hand for right-handed players). It’s amazing how much easier it is to release the club through the ball if even 1/4-1/2″ of the butt is beyond the left heel pad. Try this yourself to see what I mean. Swing the club freely with just your left hand and notice the difference in its release from when you hold it at the end of the grip, versus gripping down even a half inch.
To help you really understand how this works, go to the range and hit shots with your five-iron gripped down a full inch to make the club the same length as your seven-iron. You will probably see an amazing shot shape difference, and likely not see as much distance loss as you would expect.
Too much lower (right) hand on the club
It seems like almost all golfers of 8-10 handicap or higher have the club too far into the palm of the lower hand, because that feels “good” if you are trying to control the path of the clubhead to the ball. But the golf swing is not an effort to hit at the ball – it is a swing of the club. The proper hold on the club has the grip underneath the pad at the base of the fingers. This will likely feel “weak” to you — like you cannot control the club like that. EXACTLY. You should not be trying to control the club with your lower/master hand.
Gripping too tightly
Nearly all golfers hold the club too tightly, which tenses up the forearms and prevents a proper release of the club through impact. In order for the club to move back and through properly, you must feel that the club is controlled by the last three fingers of the upper hand, and the middle two fingers of the lower hand. If you engage your thumbs and forefingers in “holding” the club, the result will almost always be a grip that is too tight. Try this for yourself. Hold the club in your upper hand only, and squeeze firmly with just the last three fingers, with the forefinger and thumb off the club entirely. You have good control, but your forearms are not tense. Then begin to squeeze down with your thumb and forefinger and observe the tensing of the entire forearm. This is the way we are made, so the key to preventing tenseness in the arms is to hold the club very lightly with the “pinchers” — the thumbs and forefingers.
So, those are what I believe are the four fundamentals of a good grip. Anyone can learn them in their home or office very quickly. There is no easier way to improve your ball striking consistency and add distance than giving more attention to the way you hold the golf club.
More from the Wedge Guy
- The Wedge Guy: Golf mastery begins with your wedge game
- The Wedge Guy: Why golf is 20 times harder than brain surgery
- The Wedge Guy: Musings on the golf ball rollback
- LIKE68
- LEGIT10
- WOW3
- LOL1
- IDHT0
- FLOP3
- OB0
- SHANK4

As the Florida swing comes to an end, the PGA Tour makes its way to Houston to play the Texas Children’s Houston Open at Memorial Park Golf Course.
This will be the fourth year that Memorial Park Golf Course will serve as the tournament host. The event did not take place in 2023, but the course hosted the event in 2020, 2021 and 2022.
Memorial Park is a par-70 layout measuring 7,432 yards and features Bermudagrass greens. Historically, the main defense for the course has been thick rough along the fairways and tightly mown runoff areas around the greens. Memorial Park has a unique setup that features three Par 5’s and five Par 3’s.
The field will consist of 132 players, with the top 65 and ties making the cut. There are some big names making the trip to Houston, including Scottie Scheffler, Wyndham Clark, Tony Finau, Will Zalatoris and Sahith Theegala.
Past Winners at Memorial Park
- 2022: Tony Finau (-16)
- 2021: Jason Kokrak (-10)
- 2020: Carlos Ortiz (-13)
In this article and going forward, I’ll be using the Rabbit Hole by Betsperts Golf data engine to develop my custom model. If you want to build your own model or check out all of the detailed stats, you can sign up using promo code: MATTVIN for 25% off any subscription package (yearly is best value).
Key Stats For Memorial Park
Let’s take a look at several metrics for Memorial Park to determine which golfers boast top marks in each category over their last 24 rounds:
Strokes Gained: Approach
Memorial Park is a pretty tough golf course. Golfers are penalized for missing greens and face some difficult up and downs to save par. Approach will be key.
Total Strokes Gained: Approach per round in past 24 rounds:
- Tom Hoge (+1.30)
- Scottie Scheffler (+1.26)
- Keith Mitchell (+0.97)
- Tony Finau (+0.92)
- Jake Knapp (+0.84)
Strokes Gained: Off the Tee
Memorial Park is a long golf course with rough that can be penal. Therefore, a combination of distance and accuracy is the best metric.
Total Strokes Gained: Off the Tee per round in past 24 rounds:
- Scottie Scheffler (+0.94)
- Kevin Dougherty (+0.93)
- Cameron Champ (+0.86)
- Rafael Campos (+0.84)
- Si Woo Kim (+0.70)
Strokes Gained Putting: Bermudagrass + Fast
The Bermudagrass greens played fairly fast the past few years in Houston. Jason Kokrak gained 8.7 strokes putting on his way to victory in 2021 and Tony Finau gained in 7.8 in 2022.
Total Strokes Gained Putting (Bermudagrass) per round past 24 rounds (min. 8 rounds):
- Adam Svensson (+1.27)
- Harry Hall (+1.01)
- Martin Trainer (+0.94)
- Taylor Montgomery (+0.88)
- S.H. Kim (+0.86)
Strokes Gained: Around the Green
With firm and undulating putting surfaces, holding the green on approach shots may prove to be a challenge. Memorial Park has many tightly mowed runoff areas, so golfers will have challenging up-and-down’s around the greens. Carlos Ortiz gained 5.7 strokes around the green on the way to victory in 2020.
Total Strokes Gained: Around the Green per round in past 24 rounds:
- Mackenzie Hughes (+0.76)
- S.H. Kim (+0.68)
- Scottie Scheffler (+0.64)
- Jorge Campillo (+0.62)
- Jason Day (+0.60)
Strokes Gained: Long and Difficult
Memorial Park is a long and difficult golf course. This statistic will incorporate players who’ve had success on these types of tracks in the past.
Total Strokes Gained: Long and Difficult in past 24 rounds:
- Scottie Scheffler (+2.45)
- Ben Griffin (+1.75)
- Will Zalatoris (+1.73)
- Ben Taylor (+1.53)
- Tony Finau (+1.42)
Course History
Here are the players who have performed the most consistently at Memorial Park.
Strokes Gained Total at Memorial Park past 12 rounds:
- Tyson Alexander (+3.65)
- Ben Taylor (+3.40)
- Tony Finau (+2.37)
- Joel Dahmen (+2.25)
- Patton Kizzire (+2.16)
Statistical Model
Below, I’ve reported overall model rankings using a combination of the five key statistical categories previously discussed.
These rankings are comprised of SG: App (24%) SG: OTT (24%); SG: Putting Bermudagrass/Fast (13%); SG: Long and Difficult (13%); SG: ARG (13%) and Course History (13%)
- Scottie Scheffler
- Wyndham Clark
- Tony Finau
- Joel Dahmen
- Stephan Jaeger
- Aaron Rai
- Sahith Theegala
- Keith Mitchell
- Jhonnatan Vegas
- Jason Day
- Kurt Kitayama
- Alex Noren
- Will Zalatoris
- Si Woo Kim
- Adam Long
2024 Texas Children’s Houston Open Picks
Will Zalatoris +2000 (Caesars)
Scottie Scheffler will undoubtedly be difficult to beat this week, so I’m starting my card with someone who I believe has the talent to beat him if he doesn’t have his best stuff.
Will Zalatoris missed the cut at the PLAYERS, but still managed to gain strokes on approach while doing so. In an unpredictable event with extreme variance, I don’t believe it would be wise to discount Zalatoris based on that performance. Prior to The PLAYERS, the 27-year-old finished T13, T2 and T4 in his previous three starts.
Zalatoris plays his best golf on long and difficult golf courses. In his past 24 rounds, he ranks 3rd in the category, but the eye test also tells a similar story. He’s contended at major championships and elevated events in the best of fields with tough scoring conditions. The Texas resident should be a perfect fit at Memorial Park Golf Club.
Alex Noren +4500 (FanDuel)
Alex Noren has been quietly playing some of his best golf of the last half decade this season. The 41-year-old is coming off back-to-back top-20 finishes in Florida including a T9 at The PLAYERS in his most recent start.
In his past 24 rounds, Noren ranks 21st in the field in Strokes Gained: Off the Tee, 30th in Strokes Gained: Around the Green, 25th in Strokes Gained: Total on long and difficult courses and 21st in Strokes Gained: Putting on fast Bermudagrass greens.
In addition to his strong recent play, the Swede also has played well at Memorial Park. In 2022, Noren finished T4 at the event, gaining 2.2 strokes off the tee and 7.0 strokes on approach for the week. In his two starts at the course, he’s gained an average of .6 strokes per round on the field, indicating he is comfortable on these greens.
Noren has been due for a win for what feels like an eternity, but Memorial Park may be the course that suits him well enough for him to finally get his elusive first PGA Tour victory.
Mackenzie Hughes +8000 (FanDuel)
Mackenzie Hughes found himself deep into contention at last week’s Valspar Championship before faltering late and finishing in a tie for 3rd place. While he would have loved to win the event, it’s hard to see the performance as anything other than an overwhelming positive sign for the Canadian.
Hughes has played great golf at Memorial Park in the past. He finished T7 in 2020, T29 in 2021 and T16 in 2022. The course fit seems to be quite strong for Hughes. He’s added distance off the tee in the past year or and ranks 8th in the field for apex height, which will be a key factor when hitting into Memorial Park’s elevated greens with steep run-off areas.
In his past 24 rounds, Hughes is the best player in the field in Strokes Gained: Around the Greens. The ability to scramble at this course will be extremely important. I believe Hughes can build off of his strong finish last week and contend once again to cement himself as a President’s Cup consideration.
Akshay Bhatia +8000 (FanDuel)
Akshay Bhatia played well last week at the Valspar and seemed to be in total control of his golf ball. He finished in a tie for 17th and shot an impressive -3 on a difficult Sunday. After struggling Thursday, Akshay shot 68-70-68 in his next three rounds.
Thus far, Bhatia has played better at easier courses, but his success at Copperhead may be due to his game maturing. The 22-year-old has enormous potential and the raw talent to be one of the best players in the world when he figures it all out.
Bhatia is a high upside play with superstar qualities and may just take the leap forward to the next stage of his career in the coming months.
Cameron Champ +12000 (FanDuel)
Cameron Champ is a player I often target in the outright betting market due to his “boom-or-bust” nature. It’s hard to think of a player in recent history with three PGA Tour wins who’s been as inconsistent as Champ has over the course of his career.
Despite the erratic play, Cam Champ simply knows how to win. He’s won in 2018, 2019 and 2021, so I feel he’s due for a win at some point this season. The former Texas A&M product should be comfortable in Texas and last week he showed us that his game is in a pretty decent spot.
Over his past 24 rounds, Champ ranks 3rd in Strokes Gained: Off the Tee and 30th in Strokes Gained: Total on long and difficult courses. Given his ability to spike at any given time, Memorial Park is a good golf course to target Champ on at triple digit odds.
Robert MacIntyre +12000 (FanDuel)
The challenge this week is finding players who can possibly beat Scottie Scheffler while also not dumping an enormous amount of money into an event that has a player at the top that looks extremely dangerous. Enter McIntyre, who’s another boom-or-bust type player who has the ceiling to compete with anyone when his game is clicking on all cylinders.
In his past 24 rounds, MacIntyre ranks 16th in the field in Strokes Gained: Off the Tee, 17th in Strokes Gained: Around the Green and 10th in Strokes Gained: Total on long and difficult courses.
MacIntyre’s PGA Tour season has gotten off to a slow start, but he finished T6 in Mexico, which is a course where players will hit driver on the majority of their tee shots, which is what we will see at Memorial Park. Texas can also get quite windy, which should suit MacIntyre. Last July, the Scot went toe to toe with Rory McIlroy at the Scottish Open before a narrow defeat. It would take a similar heroic effort to compete with Scheffler this year in Houston.
Ryan Moore +15000 (FanDuel)
Ryan Moore’s iron play has been absolutely unconscious over his past few starts. At The PLAYERS Championship in a loaded field, he gained 6.1 strokes on approach and last week at Copperhead, he gained 9.0 strokes on approach.
It’s been a rough handful of years on Tour for the 41-year-old, but he is still a five-time winner on the PGA Tour who’s young enough for a career resurgence. Moore has chronic deterioration in a costovertebral joint that connects the rib to the spine, but has been getting more consistent of late, which is hopefully a sign that he is getting healthy.
Veterans have been contending in 2024 and I believe taking a flier on a proven Tour play who’s shown signs of life is a wise move at Memorial Park.
- LIKE13
- LEGIT1
- WOW1
- LOL0
- IDHT0
- FLOP0
- OB0
- SHANK2
B.F. Skinner was one of the most important psychologists of the 20th century, developing the foundation of the development of reinforcement, and in doing so, creating the concept of behaviorism. In simple terms, this means that we are conditioned by our habits. In practical terms, it explains the divide between the few and far between elite instructors and college coaches.
To understand the application, let’s quickly review one of B.F. Skinner’s most important experiments; superstitions in the formation of behavior by pigeons. In this experiment, food was dispensed to pigeons at random intervals. Soon, according to Skinner, the pigeons began to associate whatever action they were doing at the time of the food being dispensed. According to Skinner, this conditioned that response and soon, they simply haphazardly repeated the action, failing to distinguish between cause and correlation (and in the meantime, looking really funny!).
Now, this is simply the best way to describe the actions of most every women’s college golf coach and too many instructors in America. They see something work, get positive feedback and then become conditioned to give the feedback, more and more, regardless of if it works (this is also why tips from your buddies never work!).
Go to a college event, particularly a women’s one, and you will see coaches running all over the place. Like the pigeons in the experiment, they have been conditioned into a codependent relationship with their players in which they believe their words and actions, can transform a round of golf. It is simply hilarious while being equally perturbing
In junior golf, it’s everywhere. Junior golf academies make a living selling parents that a hysterical coach and over-coaching are essential ingredients in your child’s success.
Let’s be clear, no one of any intellect has any real interest in golf — because it’s not that interesting. The people left, including most coaches and instructors, carve out a small fiefdom, usually on the corner of the range, where they use the illusion of competency to pray on people. In simple terms, they baffle people with the bullshit of pseudo-science that they can make you better, after just one more lesson.
The reality is that life is an impromptu game. The world of golf, business, and school have a message that the goal is being right. This, of course, is bad advice, being right in your own mind is easy, trying to push your ideas on others is hard. As a result, it is not surprising that the divorce rate among golf professionals and their instructors is 100 percent. The transfer rate among college players continues to soar, and too many courses have a guy peddling nefarious science to good people. In fact, we do at my course!
The question is, what impact does all this have on college-age and younger kids? At this point, we honestly don’t know. However, I am going to go out on a limb and say it isn’t good.
Soren Kierkegaard once quipped “I saw it for what it is, and I laughed.” The actions of most coaches and instructors in America are laughable. The problem is that I am not laughing because they are doing damage to kids, as well as driving good people away from this game.
The fact is that golfers don’t need more tips, secrets, or lessons. They need to be presented with a better understanding of the key elements of golf. With this understanding, they can then start to frame which information makes sense and what doesn’t. This will emancipate them and allow them to take charge of their own development.
- LIKE14
- LEGIT4
- WOW1
- LOL2
- IDHT0
- FLOP1
- OB0
- SHANK11


The Wedge Guy: Golf mastery begins with your wedge game

Tour pro calls Anthony Kim a ‘f*****g idiot’ following Instagram comeback post

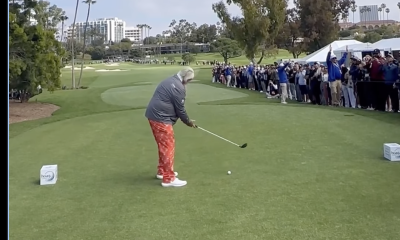
John Daly stuns fans into silence with brutal opening tee shot on PGA Tour Champions

Anthony Kim WITB 2024 (February)

This Rory McIlroy post-round ‘The Match’ moment is going viral…but all is likely not what it seems

Scottie Scheffler WITB 2024 (March)

Photos from the 2024 Arnold Palmer Invitational

Anthony Kim’s speculated LIV Golf sign-on fee may surprise you

6-time Euro Tour champ says Patrick Cantlay ‘should be nailed with a huge fine’ over Genesis incident

The total sum that Sergio Garcia needs to pay in fines if he wants to return to DP World Tour revealed

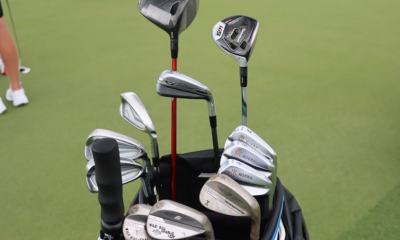
Chesson Hadley WITB 2024 (March)
Chesson Hadley what’s in the bag accurate as of the Texas Children’s Houston Open. More photos from the event here....

Gary Woodland WITB 2024 (March)
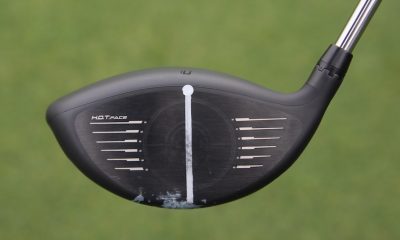
Driver: Cobra Darkspeed X (8 degrees) Shaft: Accra TZ5 70 M5 The white circle that appears at the top of...

Zac Blair WITB 2024 (March)
Zac Blair what’s in the bag accurate as of the Texas Children’s Houston Open. More photos from the event here....
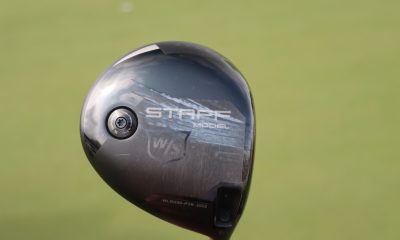

Martin Trainer WITB 2024 (March)
Martin Trainer what’s in the bag accurate as of the Texas Children’s Houston Open. More photos from the event here....
-
 19th Hole6 days ago
John Daly stuns fans into silence with brutal opening tee shot on PGA Tour Champions
-

 19th Hole1 week ago
2-time major champ announces shock retirement from the sport at age of 33
-
 19th Hole6 days ago
Charlie Woods finds it tough going on American Junior Golf Association debut
-

 19th Hole2 weeks ago
Edoardo Molinari reveals the latest PGA Tour golfer to turn down ‘good offer’ from LIV Golf
-

 Equipment3 weeks ago
Best driver 2024: The best driver for you, as recommend by expert club fitters
-
 19th Hole2 weeks ago
Scottie Scheffler had an interesting response when asked how he ‘quiets the noise’ following Players victory
-
 19th Hole2 weeks ago
Jon Rahm dealt fresh blow to hopes of qualifying for 2025 Ryder Cup
-
 19th Hole1 week ago
Why Kevin Streelman sought USGA approval to use this equipment tool as he leads Valspar after round one
Jaacob Bowden
Jan 7, 2013 at 10:34 am
Ruddy – Haha, yeah, especially on new courses it helps to pay attention right away. :-p
Hmmm, if I remember correctly, Advanced Golf Solutions also tested the balls by accuracy. So you could pick something out based on any number of variables…distance, accuracy, price, etc.
I think the ProV1x was the most accurate…or at least in the top 3. But that was a few years ago. Ball models change as time passes.
They must’ve gone out of business because I’m not finding their website…which is too bad because it was really cool software. They tested the top 50 or so new balls on the market each year for several years.
Ruddy
Jan 5, 2013 at 1:08 pm
Jacob, thanks for answering. I too noticed a big difference in distance between balls. 10 yards less with Titleist Velocity vs. ProV1x. Better scores with the expensive ball, also. I never seem to recognize the distance variation each round until around Hole#18!
Jaacob Bowden
Jan 4, 2013 at 10:38 pm
Ruddy – Yeah, using the same model ball can definitely help consistency. I remember one time I did some new ball testing using some independent testing software (I believe made by Advanced Golf Solutions) and there was literally a 50 yard difference between the longest ball and shortest ball for me (that variance will be more or less depending on swing speed and other factors).
I just do it as a rough percentage because during a single practice round I may not get enough flat shots (no elevation changes) without wind to get an average for each club.
In situations where I don’t get in a practice round, I just try to pay really close attention on the first few holes and adjust up or down accordingly as quickly as I can.
Ruddy
Jan 3, 2013 at 8:08 pm
Interesting article. Averages are greatly affected by extremes, so good move to eliminate extremely long and short distances. The mode is the distance most often achieved. The median is the distance exactly in the middle. Rather than a percentage change, why not just use actual distance achieved for each club in the practice round? If I can’t play a practice round, how can I make a distance adjustment using some other method? I suppose using the same ball brand helps consistency. Thanks.
Jaacob Bowden
Dec 29, 2012 at 3:58 pm
Al, Mark, Steve…thanks!
Good suggestion, Steve. Those things definitely do have an effect on distance. I know I’ve seen studies that have covered this but I don’t recall specifics or where I saw them off the top of my head. I’ll put it on my list of article ideas for the future!
Happy New Year!
Steve
Dec 29, 2012 at 2:56 pm
Jaacob, nice article. I wish you would have spent some time discussing temperature and it’s effect on distance. Don’t golf balls fly further in the heat vs. cold air? What about in high humidity/fog, vs. dry air? Thanks!
Mark Bishop
Dec 21, 2012 at 9:50 pm
Very interesting Jaacob and well put together. All the very best for the Hols mate. Mark in Oz!
Al Dilz
Dec 21, 2012 at 8:28 pm
Very informative, Jaacob. I have never seen distance variables covered with such precision and detail. Thank you!
Jaacob Bowden
Dec 21, 2012 at 1:24 pm
Thanks gents!
DJ Watts
Dec 21, 2012 at 12:53 pm
Jaacob, I love your attention to numbers and stats, it’s right up my alley!
Congrats on a solid first piece, and I’m looking forward to applying the playing and strategy knowledge that you relay.
Brian Cass
Dec 20, 2012 at 8:55 pm
Great article, a subject that is hardly covered