Opinion & Analysis
How Different Kinds of Breaking Putts Affect Tour Player Performance

Editor’s Note: This is an excerpt from Rich Hunt’s 2017 Pro Golf Synopsis, which can be purchased here for $10. Stylistic changes were made to the story for online publication.
—
At the start of the 2015-2016 season, PGATour.com introduced the Strackaline app to ShotTracker. The app provides 3D topographical scans of each green on the PGA Tour, but its presence with the Tour was short-lived. By early 2016, the Tour stopped using the app in conjunction with ShotTracker. I found the Strackaline app to be helpful in exploring something we have long wondered about; how well Tour players putt on different types of breaking putts.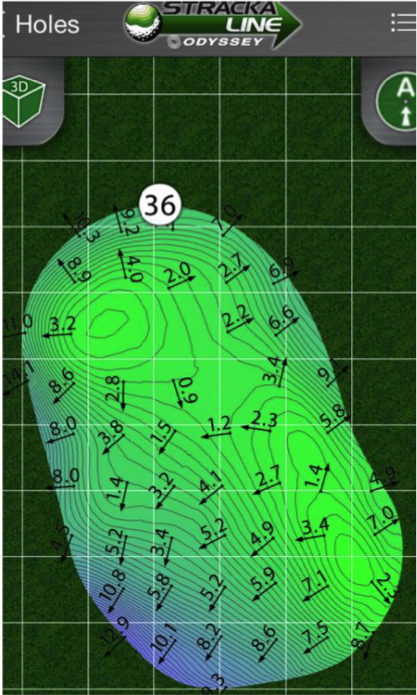
I was excited to use this app for my own Tour clients to help them with their putting, and I started to notice some interesting trends. Poor putters putted differently from average putters, and average putters putted differently from great putters. Some characteristics started to emerge when players putted significantly better than normal, as well as when they putted significantly worse than normal.
I then used that data and explore other random players: great putters, better-than-average putters, average putters, worse-than-average putters, and the worst putters on Tour. I was interested in seeing how different golfers putted from certain locations on the Fall Line Clock to see if there were any similar characteristics or trends with their putting.
Methodology
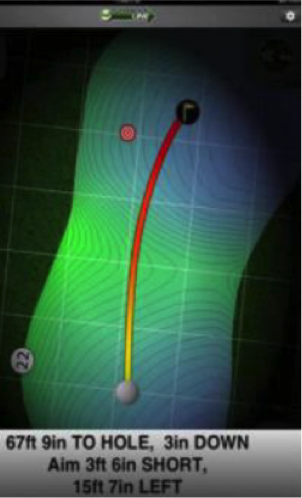
The Tour’s decision to stop using the Strackaline app made my research more difficult. The good news is that the Strackaline app has a function that allows you to place the pin in the position where you think it is located on the green. Then you can place a golf ball on a spot on the green and Strackaline will give the distance to the hole, as well as the contours of the particular putt and where exactly golfers should aim.
Granted, I cannot say that I was 100 percent accurate on my estimations of flag and putt location, but I did examine the following putts:
1. Putts that were on a very planar slope.
These are putts that have one break to them and are not double breakers. They don’t sit on a crown or in a “saddle.” I tried to get putts that were essentially right on one particular position on the Fall Line clock. Any putt that was too difficult to tell, I did not record the data.
2. Putts from 4-20 feet.
These are makeable putts that require more precise green reading, aim, touch/speed and stroke mechanics. I examined 38 right-handed-putting Tour players ranging from excellent putters like Luke Donald and Mackenzie Hughes to the worst putters on Tour like Boo Weekley and Robert Garrigus. In particular, I sighted events where the player was either greater than 1 standard deviation in Putts Gained for the entire event or worse than 1 standard deviation in Putts Gained for the entire event.
Matt Jones was a player I examined. For the 2016-2017 season, his Putts Gained was +0.170 per round. His standard deviation for the year was 0.7092. So I researched two events that he was greater than +0.8792 strokes per round (the AT&T Pebble Beach Pro-Am and The Greenbrier Classic) along with the two events where he putted worse than -0.5392 strokes per round (the AT&T Byron Nelson and the Shell Houston Open). I also examined four more events for Jones that were right around his average for the season.
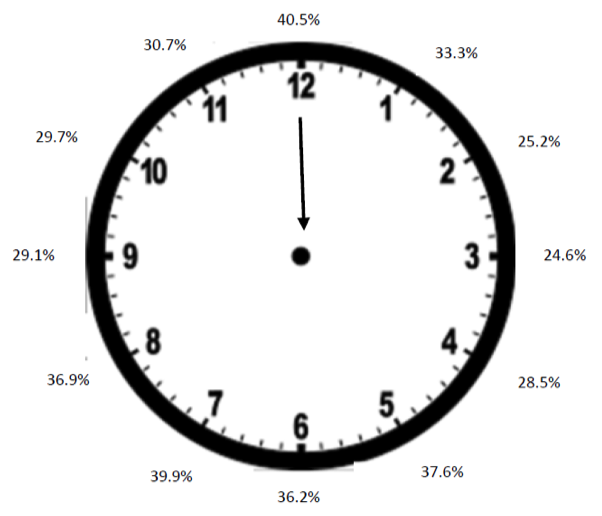
Here’s a representation of the Fall Line Clock from golf instructor John Dunigan.
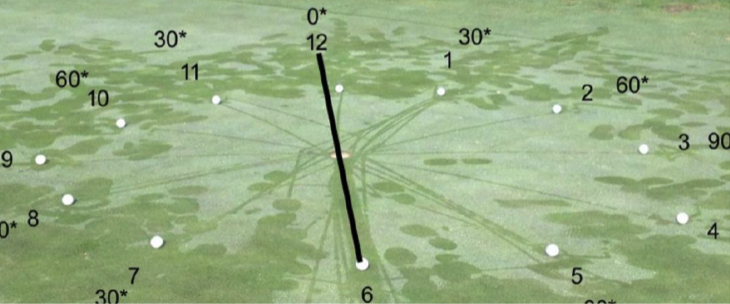
Twelve and 6 o’clock represent straight putts (12 o’clock is a straight downhill putt and 6 o’clock is a straight uphill putt). Putts from 4 to 8 o’clock are on an uphill gradient, and putts from 10 to 2 o’clock are on a downhill gradient. Putts from 1 to 5 o’clock break to the left, and putts from 7 to 11 o’clock break to the right.
Lastly, I normalized the data so the putting performance from each position on the Fall Line Clock would represent a probable make percentage from 10 feet. On average, 10-foot putts have a 38 percent make percentage on Tour.
Make Percentages from Different Locations
Here are the make percentages of all of the golfers and rounds I examined. I normalized the data to reflect the projected make probabilities from 10 feet, as well as how the normalized data works out.
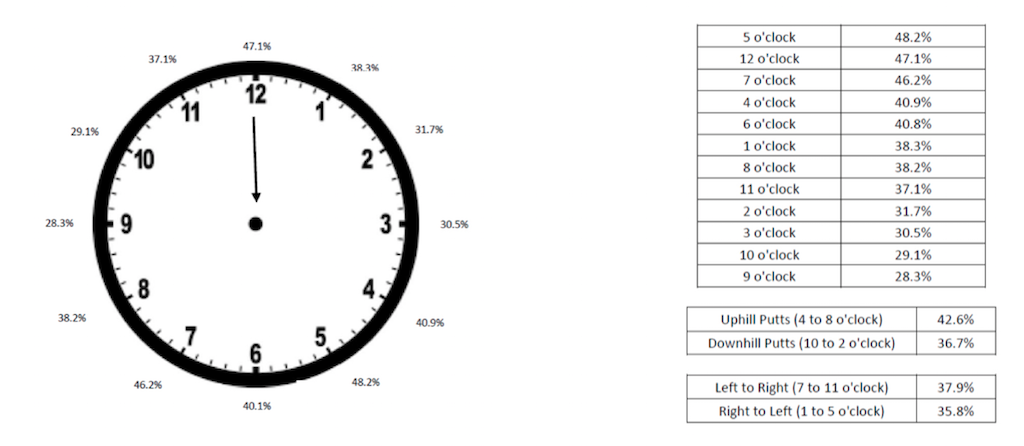
There is a theory that downhill putts are easier to make than uphill putts. The reason is that the force vectors on a downhill putt tend to get the ball breaking toward the hole. With uphill putts, the force vectors tend to get the ball breaking away from the hole. My research refutes this theory to a degree. The make percentages are significantly higher on uphill putts, however; the second-highest make percentage location is at the 12 o’clock position (straight downhill).
My conclusion is that the downhill straight putt is very easy to make, but once the putt gets away from the 12 o’clock position it becomes increasingly more difficult to make. In summation, the more a putt breaks the more difficult it is to make — and uphill putts will break less than downhill putts.
Lastly, the players (all right-handed putters) had a slight bias in right-to-left putts versus left-to-right putts. This has been a common theory for as long as I can remember, and it held up to be true. The difference in make percentage, however, may be smaller than many people think it should be.
Break Biases and Putting Skill
The research showed a very strong trend in a player’s bias toward right-to-left or left-to-right breaking putts depending on their skill. I labeled golfers in the following categories:
- Greatest Putter (Upper 90th Percentile in Putts Gained or roughly top-20 in Putts Gained)
- Worst Putter (Lower 10th Percentile in Putts Gained or roughly ranking 170th or worse in Putts Gained)
- Good Putter (ranking roughly 30th to 70th in Putts Gained)
- Mediocre Putter (ranking roughly 120th to 160th in Putts Gained)
- Average Putter (ranking roughly 80th to 105th in Putts Gained)
I found that the vast majority of the players I analyzed had a significant bias toward either right-to-left or left-to-right breaking putts. Here’s an example of PGA Tour player Richy Werenski, who finished the year at 0.000 in Putts Gained. He neither gained nor lost strokes to the field for the entire season with his putter.

Richy Werenski’s make probabilities on the Fall Line Clock.
Werenski had a clear bias toward right-to-left putts (40.7 percent) versus left-to-right putts (33.7 percent). Just because a player was putting right-handed, however, did not mean the player would automatically have a bias toward right-to-left putts.
Here’s a breakdown of Rory McIlroy’s make probabilities on the Fall Line Clock.
Rory McIlroy’s make probabilities on the Fall Line Clock.
Outside of the 11 o’clock versus the 1 o’clock position, McIlroy had a bias toward making left-to-right putts versus the corresponding location that broke right-to-left.
As it turns out, the putters that did not have a bias were from the “Greatest Putters” group. They had no significant bias toward leftward or rightward breaking putts. Mackenzie Hughes was a good example of this, as he finished 8th in Putts Gained. Not only did he make a high percentage of putts from most locations on the Fall Line Clock, but he did not have a significant bias toward rightward or leftward breaking putts.

Mackenzie Hughes’ make probabilities on the Fall Line Clock.
Out of all of the players I researched, making putts at 12 o’clock (straight-downhill), 6 o’clock (straight uphill) and 5 o’clock (uphill, breaks left) were consistently the putts with some of the highest make percentages out of all the Fall Line locations. The only players that could struggle to reach the normalized make percentage average of 38 percent from 10 feet from those locations were the “Worst Putters.” It was not always the case with some of the Worst Putters, but there was a segment of the population that could struggle to make those putts.
One of the conclusions I derived from this was that good putting is not necessarily about holing putts. It is fairly easy for better players to make relatively straight putts, and sometimes in a round the golfer may just happen to get a lot of putts that are fairly straight. On the other hand, the golfer may get a lot of breaking putts. That was one of the amazing things about Jim Furyk’s 58 at TPC River Highlands; only two of his putts were not fairly straight. Obviously his ball striking was phenomenal and he holed putts to shoot 58, but there was a certain amount of luck involved in continually getting favorable putt locations.
Break Biases on Performances Outside of Standard Deviation
I wanted to examine the times that golfers putted better or worse than one standard deviation. What are the commonalities when golfers putt significantly better or significantly worse than normal? Golfers that putted one standard deviation worse than their mean in Putts Gained did not have any noticeable change in their putting other than they just putted worse overall. This was particularly the case in breaking putts. The bias remained the same.
Here’s a look at the putting make probabilities from Billy Horschel on average versus the events where his putting was one standard deviation worse than the mean.
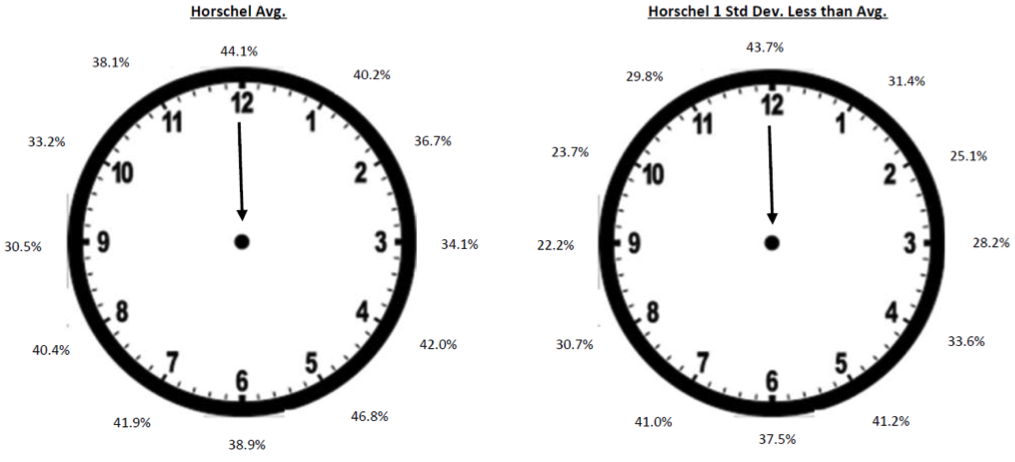
The results were different, however, when I examined golfers that putted one standard deviation greater than their mean. Horschel had a bias toward right-to-left breaking putts on his poor putting performances. The bias went away when he putted better than one standard deviation from his norm.
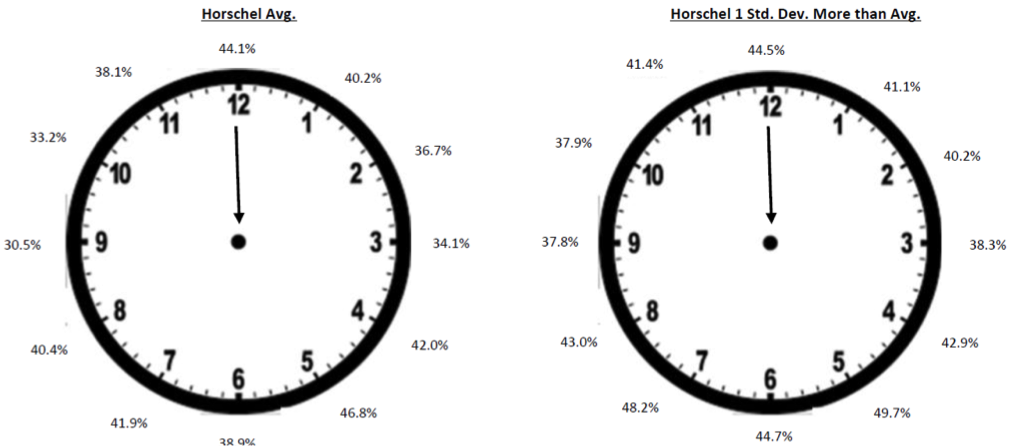
This was common with virtually every player I studied except for the “Greatest Putters” group, as they did not have a bias toward breaking putts to begin with. If they had a bias towards a particular break, they would often putt even better when they putted significantly better than normal. But they made incredible gains on the putts that broke in a direction that caused them problems — to the point that they were putting as well as they did on the breaking putts they preferred and no longer had a bias.
Conclusions
Based on the data we know the following:
- Tour players greatly favor uphill versus downhill putts as a whole.
- The exception was from 12 o’clock (straight-downhill).
- The best location for right-handed-putting Tour players was at 5 o’clock (uphill, slight break to the left).
- The vast majority of Tour players had some sort of bias toward right-to-left or left-to-right breaking putts.
- Not all right-handed-putting Tour players preferred right-to-left putts.
- As a whole, there was a moderate preference toward right-to-left putts from right-handed-putting Tour players.
- The best putters had virtually no bias toward right-to-left or left-to-right breaking putts.
- Virtually all Tour players consistently favored the 5 o’clock, 12 o’clock and 6 o’clock positions.
- The only Tour players that struggled with straight putts (6 or 12 o’clock) were in the “Worst Putters” category.
- Break bias disappears for a Tour player when they putt one standard deviation better than their mean in Putts Gained.
- Break bias is still present when the Tour player putts one standard deviation worse than their mean in Putts Gained.
For the non-Tour golfer, the data suggests that initial practice on putting should be done on straight putts. The only players I studied that did not do well on straight putts on occasion were the worst putters on Tour. While there has been debate as to how well Tour players putt in relation to the entire world’s golf population, I still tend to believe that even the worst putters on Tour are likely better than any segment of amateur golfers. Thus, if the worst putters of the Tour population can struggle with the straight putts, there’s a strong likelihood that amateur golfers will need to work on straight putts first in order to make a significant improvement in their putting over time.
Once straight putting develops, I recommend that golfers determine how well they putt on right-to-left versus left-to-right breaking putts and see if they have a bias toward a particularly type of break. I recommend that they try to hit putts from various distances and locations between 2 to 4 o’clock (right-to-left) versus 8 to 10 o’clock (left-to-right). It would be best to putt one ball from one side of the hole and then putt the next ball from the opposite side in order to truly determine bias.
Once bias is determined, I would recommend seeking instruction to determine what may be causing the bias against a particular breaking putt. Work on your green reading, stroke mechanics and speed/touch to improve your ability to make more putts from your weak side of the cup. Once you can become a stable putter on uphill putts and erase the bias on breaking putts, you will see much better results and more consistency in your ability to make putts on the course.
- LIKE94
- LEGIT10
- WOW22
- LOL1
- IDHT0
- FLOP0
- OB0
- SHANK16


The PGA TOUR heads to New Orleans to play the 2023 Zurich Classic of New Orleans. In a welcome change from the usual stroke play, the Zurich Classic is a team event. On Thursday and Saturday, the teams play best ball, and on Friday and Sunday the teams play alternate shot.
TPC Louisiana is a par 72 that measures 7,425 yards. The course features some short par 4s and plenty of water and bunkers, which makes for a lot of exciting risk/reward scenarios for competitors. Pete Dye designed the course in 2004 specifically for the Zurich Classic, although the event didn’t make its debut until 2007 because of Hurricane Katrina.
Coming off of the Masters and a signature event in consecutive weeks, the field this week is a step down, and understandably so. Many of the world’s top players will be using this time to rest after a busy stretch.
However, there are some interesting teams this season with some stars making surprise appearances in the team event. Some notable teams include Patrick Cantlay and Xander Schauffele, Rory McIlroy and Shane Lowry, Collin Morikawa and Kurt Kitayama, Will Zalatoris and Sahith Theegala as well as a few Canadian teams, Nick Taylor and Adam Hadwin and Taylor Pendrith and Corey Conners.
Past Winners at TPC Louisiana
- 2023: Riley/Hardy (-30)
- 2022: Cantlay/Schauffele (-29)
- 2021: Leishman/Smith (-20)
- 2019: Palmer/Rahm (-26)
- 2018: Horschel/Piercy (-22)
- 2017: Blixt/Smith (-27)
2024 Zurich Classic of New Orleans Picks
Tom Hoge/Maverick McNealy +2500 (DraftKings)
Tom Hoge is coming off of a solid T18 finish at the RBC Heritage and finished T13 at last year’s Zurich Classic alongside Harris English.
This season, Hoge is having one of his best years on Tour in terms of Strokes Gained: Approach. In his last 24 rounds, the only player to top him on the category is Scottie Scheffler. Hoge has been solid on Pete Dye designs, ranking 28th in the field over his past 36 rounds.
McNealy is also having a solid season. He’s finished T6 at the Waste Management Phoenix Open and T9 at the PLAYERS Championship. He recently started working with world renowned swing coach, Butch Harmon, and its seemingly paid dividends in 2024.
Keith Mitchell/Joel Dahmen +4000 (DraftKings)
Keith Mitchell is having a fantastic season, finishing in the top-20 of five of his past seven starts on Tour. Most recently, Mitchell finished T14 at the Valero Texas Open and gained a whopping 6.0 strokes off the tee. He finished 6th at last year’s Zurich Classic.
Joel Dahmen is having a resurgent year and has been dialed in with his irons. He also has a T11 finish at the PLAYERS Championship at TPC Sawgrass which is another Pete Dye track. With Mitchell’s length and Dahmen’s ability to put it close with his short irons, the Mitchell/Dahmen combination will be dangerous this week.
Taylor Moore/Matt NeSmith +6500 (DraftKings)
Taylor Moore has quickly developed into one of the more consistent players on Tour. He’s finished in the top-20 in three of his past four starts, including a very impressive showing at The Masters, finishing T20. He’s also finished T4 at this event in consecutive seasons alongside Matt NeSmith.
NeSmith isn’t having a great 2024, but has seemed to elevate his game in this format. He finished T26 at Pete Dye’s TPC Sawgrass, which gives the 30-year-old something to build off of. NeSmith is also a great putter on Bermudagrass, which could help elevate Moore’s ball striking prowess.
- LIKE7
- LEGIT3
- WOW1
- LOL1
- IDHT0
- FLOP3
- OB1
- SHANK1

After having four of the top twelve players on the leaderboard at The Masters, LIV Golf is set for their fifth event of the season: LIV Adelaide.
For both LIV fans and golf fans in Australia, LIV Adelaide is one of the most anticipated events of the year. With 35,000 people expected to attend each day of the tournament, the Grange Golf Club will be crawling with fans who are passionate about the sport of golf. The 12th hole, better known as “the watering hole”, is sure to have the rowdiest of the fans cheering after a long day of drinking some Leishman Lager.
The Grange Golf Club is a par-72 that measures 6,946 yards. The course features minimal resistance, as golfers went extremely low last season. In 2023, Talor Gooch shot consecutive rounds of 62 on Thursday and Friday, giving himself a gigantic cushion heading into championship Sunday. Things got tight for a while, but in the end, the Oklahoma State product was able to hold off The Crushers’ Anirban Lahiri for a three-shot victory.
The Four Aces won the team competition with the Range Goats finishing second.
*All Images Courtesy of LIV Golf*
Past Winners at LIV Adelaide
- 2023: Talor Gooch (-19)
Stat Leaders Through LIV Miami
Green in Regulation
- Richard Bland
- Jon Rahm
- Paul Casey
Fairways Hit
- Abraham Ancer
- Graeme McDowell
- Henrik Stenson
Driving Distance
- Bryson DeChambeau
- Joaquin Niemann
- Dean Burmester
Putting
- Cameron Smith
- Louis Oosthuizen
- Matt Jones
2024 LIV Adelaide Picks
Cameron Smith +1400 (DraftKings)
When I pulled up the odds for LIV Adelaide, I was more than a little surprised to see multiple golfers listed ahead of Cameron Smith on the betting board. A few starts ago, Cam finished runner-up at LIV Hong Kong, which is a golf course that absolutely suits his eye. Augusta National in another course that Smith could roll out of bed and finish in the top-ten at, and he did so two weeks ago at The Masters, finishing T6.
At Augusta, he gained strokes on the field on approach, off the tee (slightly), and of course, around the green and putting. Smith able to get in the mix at a major championship despite coming into the week feeling under the weather tells me that his game is once again rounding into form.
The Grange Golf Club is another course that undoubtedly suits the Australian. Smith is obviously incredibly comfortable playing in front of the Aussie faithful and has won three Australian PGA Championship’s. The course is very short and will allow Smith to play conservative off the tee, mitigating his most glaring weakness. With birdies available all over the golf course, there’s a chance the event turns into a putting contest, and there’s no one on the planet I’d rather have in one of those than Cam Smith.

Louis Oosthuizen +2200 (DraftKings)
Louis Oosthuizen has simply been one of the best players on LIV in the 2024 seas0n. The South African has finished in the top-10 on the LIV leaderboard in three of his five starts, with his best coming in Jeddah, where he finished T2. Perhaps more impressively, Oosthuizen finished T7 at LIV Miami, which took place at Doral’s “Blue Monster”, an absolutely massive golf course. Given that Louis is on the shorter side in terms of distance off the tee, his ability to play well in Miami shows how dialed he is with the irons this season.
In addition to the LIV finishes, Oosthuizen won back-to-back starts on the DP World Tour in December at the Alfred Dunhill Championship and the Mauritus Open. He also finished runner-up at the end of February in the International Series Oman. The 41-year-old has been one of the most consistent performers of 2024, regardless of tour.
For the season, Louis ranks 4th on LIV in birdies made, T9 in fairways hit and first in putting. He ranks 32nd in driving distance, but that won’t be an issue at this short course. Last season, he finished T11 at the event, but was in decent position going into the final round but fell back after shooting 70 while the rest of the field went low. This season, Oosthuizen comes into the event in peak form, and the course should be a perfect fit for his smooth swing and hot putter this week.

- LIKE12
- LEGIT3
- WOW1
- LOL1
- IDHT0
- FLOP1
- OB1
- SHANK1
Of all the clubs in our bags, wedges are almost always the simplest in construction and, therefore, the easiest to analyze what might make one work differently from another if you know what to look for.
Wedges are a lot less mysterious than drivers, of course, as the major brands are working with a lot of “pixie dust” inside these modern marvels. That’s carrying over more to irons now, with so many new models featuring internal multi-material technologies, and almost all of them having a “badge” or insert in the back to allow more complex graphics while hiding the actual distribution of mass.
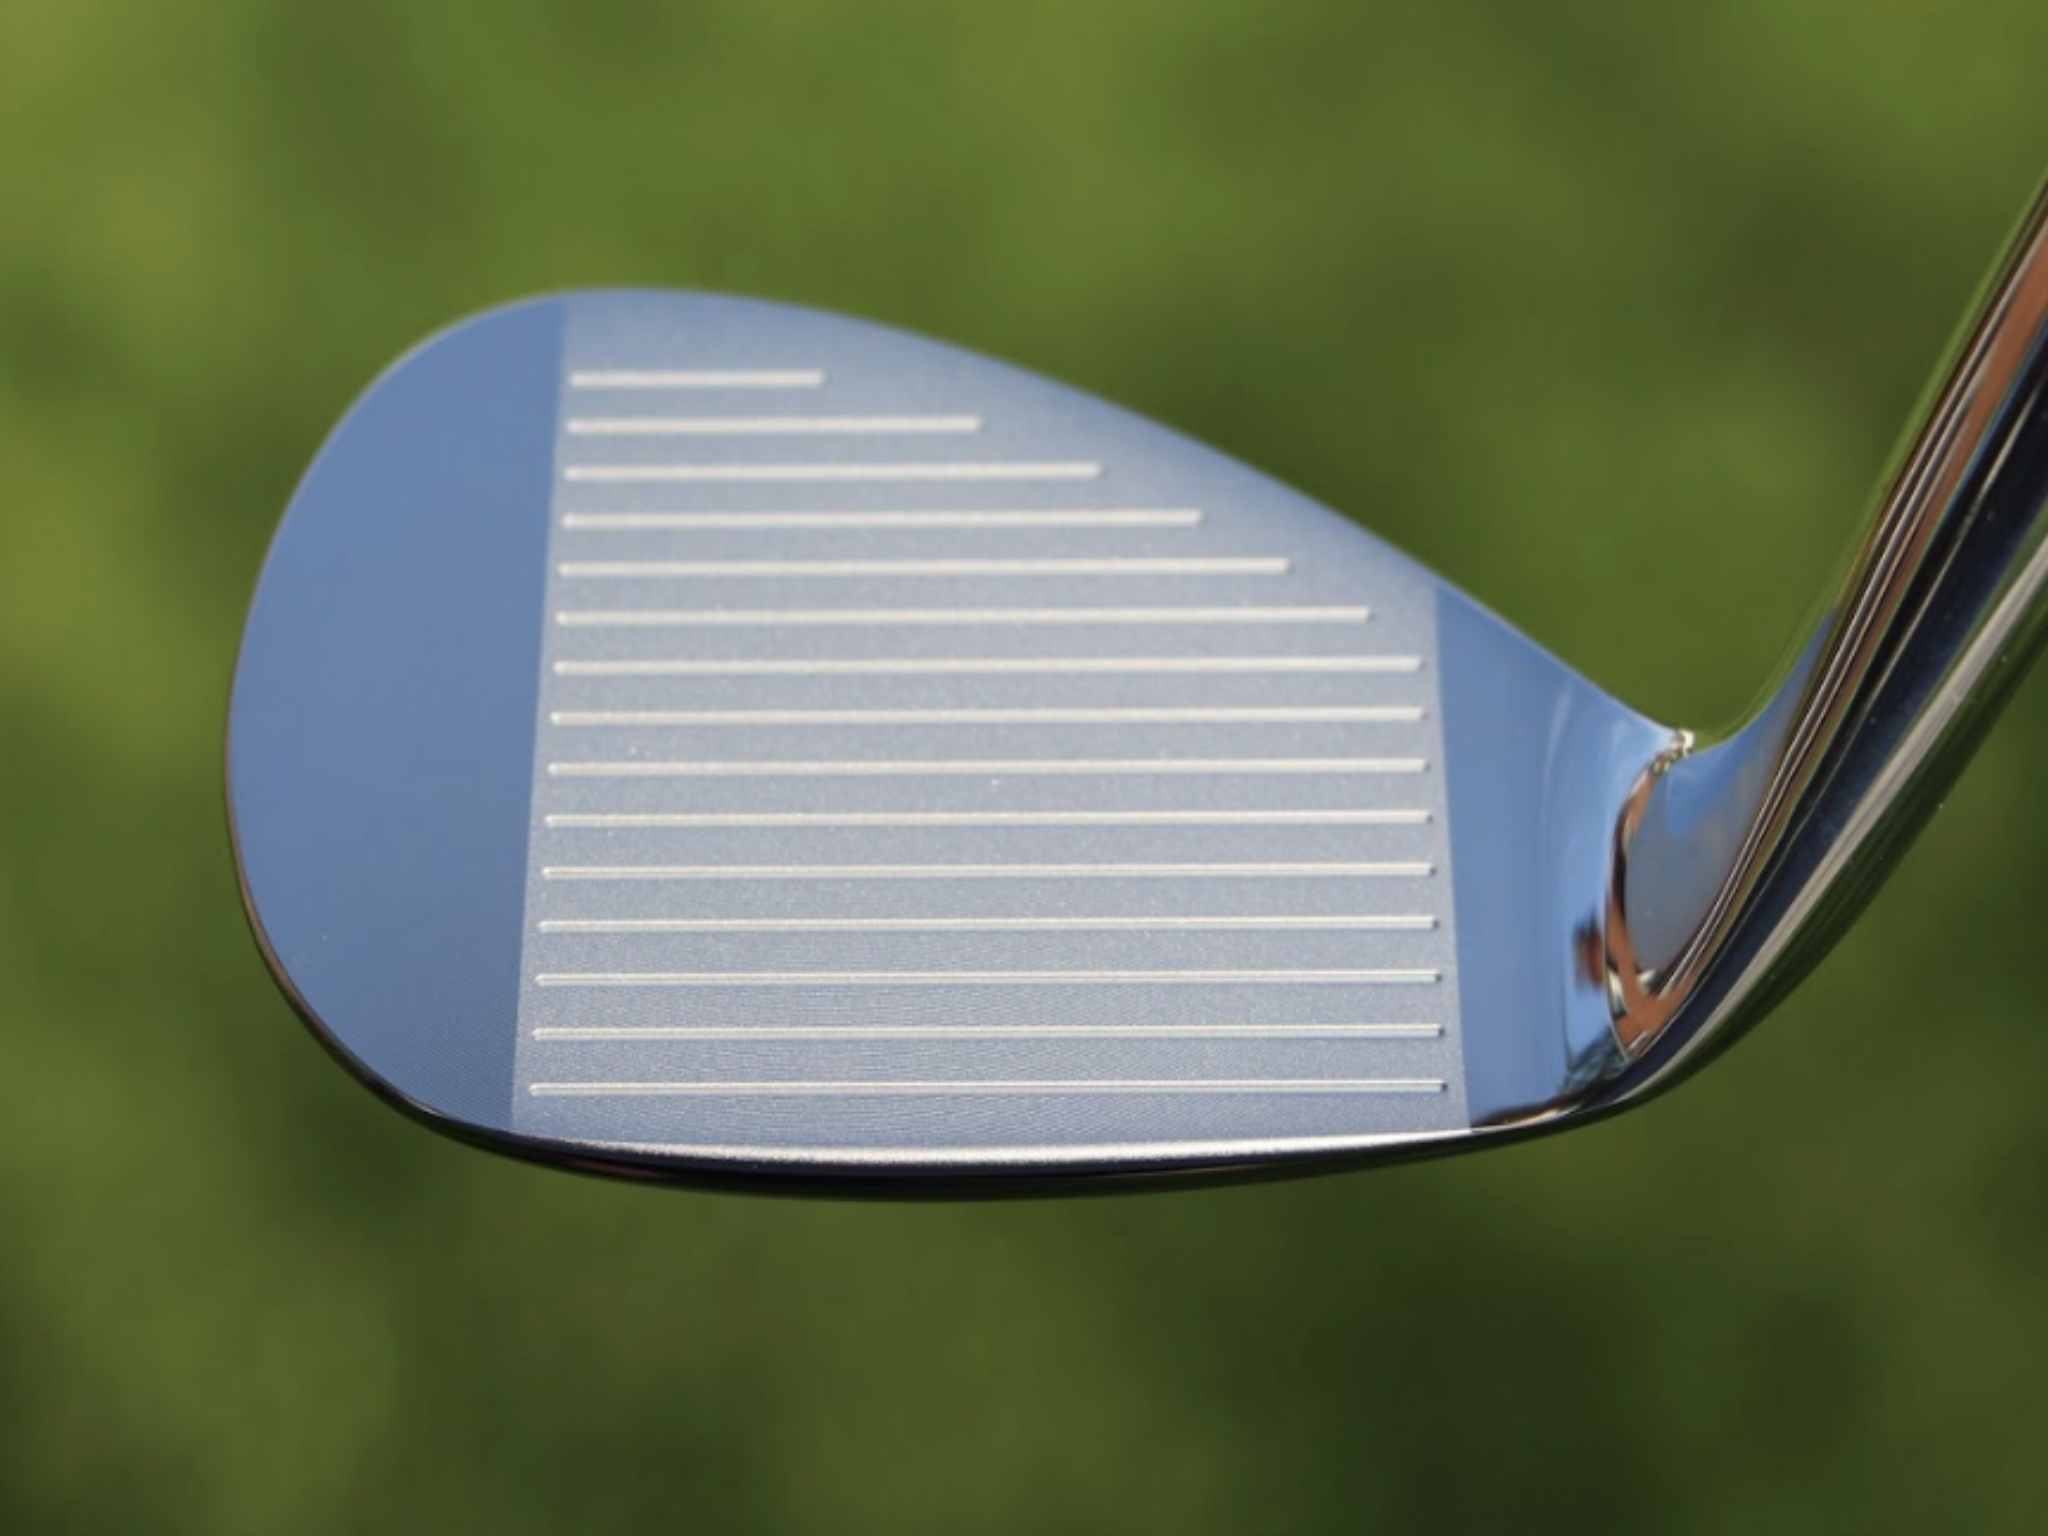
But when it comes to wedges, most on the market today are still single pieces of molded steel, either cast or forged into that shape. So, if you look closely at where the mass is distributed, it’s pretty clear how that wedge is going to perform.
To start, because of their wider soles, the majority of the mass of almost any wedge is along the bottom third of the clubhead. So, the best wedge shots are always those hit between the 2nd and 5th grooves so that more mass is directly behind that impact. Elite tour professionals practice incessantly to learn to do that consistently, wearing out a spot about the size of a penny right there. If impact moves higher than that, the face is dramatically thinner, so smash factor is compromised significantly, which reduces the overall distance the ball will fly.
Every one of us, tour players included, knows that maddening shot that we feel a bit high on the face and it doesn’t go anywhere, it’s not your fault.
If your wedges show a wear pattern the size of a silver dollar, and centered above the 3rd or 4th groove, you are not getting anywhere near the same performance from shot to shot. Robot testing proves impact even two to three grooves higher in the face can cause distance loss of up to 35 to 55 feet with modern ‘tour design’ wedges.
In addition, as impact moves above the center of mass, the golf club principle of gear effect causes the ball to fly higher with less spin. Think of modern drivers for a minute. The “holy grail” of driving is high launch and low spin, and the driver engineers are pulling out all stops to get the mass as low in the clubhead as possible to optimize this combination.
Where is all the mass in your wedges? Low. So, disregarding the higher lofts, wedges “want” to launch the ball high with low spin – exactly the opposite of what good wedge play requires penetrating ball flight with high spin.
While almost all major brand wedges have begun putting a tiny bit more thickness in the top portion of the clubhead, conventional and modern ‘tour design’ wedges perform pretty much like they always have. Elite players learn to hit those crisp, spinny penetrating wedge shots by spending lots of practice time learning to consistently make contact low in the face.
So, what about grooves and face texture?
Grooves on any club can only do so much, and no one has any material advantage here. The USGA tightly defines what we manufacturers can do with grooves and face texture, and modern manufacturing techniques allow all of us to push those limits ever closer. And we all do. End of story.
Then there’s the topic of bounce and grinds, the most complex and confusing part of the wedge formula. Many top brands offer a complex array of sole configurations, all of them admittedly specialized to a particular kind of lie or turf conditions, and/or a particular divot pattern.
But if you don’t play the same turf all the time, and make the same size divot on every swing, how would you ever figure this out?
The only way is to take any wedge you are considering and play it a few rounds, hitting all the shots you face and observing the results. There’s simply no other way.
So, hopefully this will inspire a lively conversation in our comments section, and I’ll chime in to answer any questions you might have.
And next week, I’ll dive into the rest of the wedge formula. Yes, shafts, grips and specifications are essential, too.
- LIKE32
- LEGIT7
- WOW1
- LOL1
- IDHT2
- FLOP3
- OB1
- SHANK3


Dave Portnoy places monstrous outright bet for the 2024 Masters

John Daly stuns fans into silence with brutal opening tee shot on PGA Tour Champions

Things got heated at the Houston Open between Tony Finau and Alejandro Tosti. Here’s why

Tiger Woods arrives at 2024 Masters equipped with a putter that may surprise you

Justin Thomas on the equipment choice of Scottie Scheffler that he thinks is ‘weird’

‘Absolutely crazy’ – Major champ lays into Patrick Cantlay over his decision on final hole of RBC Heritage

Report: Tiger Woods has ‘eliminated sex’ in preparation for the 2024 Masters

Two star names reportedly blanked Jon Rahm all week at the Masters

2-time major champ announces shock retirement from the sport at age of 33

Report: LIV Golf identifies latest star name they hope to sign to breakaway tour


Rasmus Højgaard WITB 2024 (April)
Rasmus Højgaard what’s in the bag accurate as of the Zurich Classic. Driver: Callaway Ai Smoke Triple Diamond (10.5 degrees)...

Rory McIlroy WITB 2024 (April)
Rory McIlroy what’s in the bag accurate as of the Zurich Classic. Driver: TaylorMade Qi10 (9 degrees) Shaft: Fujikura Ventus...


Sam Burns WITB 2024 (April)
Sam Burns’ what’s in the bag accurate as of the RBC Heritage. Driver: Callaway Paradym Triple Diamond S (9 degrees...

Will Zalatoris WITB 2024 (April)
Will Zalatoris’ what’s in the bag accurate as of the RBC Heritage. Driver: Titleist TSR2 (9 degrees, A1 SureFit setting)...
-
 19th Hole2 weeks ago
Dave Portnoy places monstrous outright bet for the 2024 Masters
-
 19th Hole2 weeks ago
Tiger Woods arrives at 2024 Masters equipped with a putter that may surprise you
-
 19th Hole2 days ago
Justin Thomas on the equipment choice of Scottie Scheffler that he thinks is ‘weird’
-
 19th Hole2 days ago
‘Absolutely crazy’ – Major champ lays into Patrick Cantlay over his decision on final hole of RBC Heritage
-
 19th Hole3 weeks ago
Report: Tiger Woods has ‘eliminated sex’ in preparation for the 2024 Masters
-
 19th Hole1 week ago
Two star names reportedly blanked Jon Rahm all week at the Masters
-
 19th Hole1 week ago
Report: LIV Golf identifies latest star name they hope to sign to breakaway tour
-
 19th Hole1 week ago
Neal Shipley presser ends in awkward fashion after reporter claims Tiger handed him note on 8th fairway
Stephen Finley
Jan 18, 2018 at 8:54 pm
This is just terrific stuff. Real research with solid methodology is all too rare in this game. Thanks for posting. I’m saving it in an email file right away.
Scott
Jan 12, 2018 at 11:31 am
Great article Rich. I was told that left vs. right eye dominance had a being on which breaking putts one would prefer. Thank you for your effort.
CB
Jan 11, 2018 at 3:13 am
Yeah I think an untucked, un-buttoned shirt can definitely affect your putting as you’re not concentrating on making it, you’re more concerned with making a fashion statement
AJ
Jan 10, 2018 at 8:24 pm
This was definitly the most interesting articles I have read on wrx so far. Currious how green speeds and slopes affected the numbers between best and worst for a player….
The dude
Jan 10, 2018 at 2:23 pm
Really really good article…… as watching putting on TV is boring idecided to track in my head just how often tour pros miss on the low side….and it amazes me that when thy miss…..it seems ~ 75% of the time they miss on the low side….even they don’t play enough break