Opinion & Analysis
Study: Why do Tour players make more par putts than birdie putts?
Editor’s Note: This is an excerpt from Rich Hunt’s 2014 Pro Golf Synopsis, which can be purchased here for $10.
This past season, PGA Tour players made an average of 39.8 percent of their birdie putts from 5-to-15 feet while making 52.6 percent of their par-or-worse putts from the same distance. That means that Tour players make a higher percentage of par-or-worse putts than they make birdie putts from the same distance.
Why? To explain, I’ll start with the numbers.
Here’s a list of the 10 Tour players who saw the largest drop-off in their birdie make percentage from their par or worse make percentage:
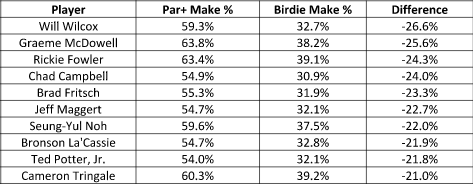
Only two players on the PGA Tour — Luke Donald and Kevin Streelman — made a higher percentage of their birdie putts than par-or-worse putts from 5-to-15 feet in the 2013-2014 season.
At first, I thought Tour players made more par-or-worse putts than birdie putts because they were more likely to have birdie putts that were downhill. Studies done by golf researchers show that in general players make a higher percentage of uphill putts from the same distance than downhill putts.
The other premonition I had was that on par-or-worse putts Tour players were more likely to have gotten a feel for that particular green. More often than not, Tour players are trying to make a birdie with either a putt on the green or a chip from just off the green. They get a better feel for the green on the putt or chip and then have a better understanding of how to make the next putt.
In February 2011, in the American Economic Review authors Devin Pope and Maurice Schweitzer examined this in the article titled Is Tiger Woods Loss Averse? Persistent Bias in the Face of Experience, Competition, and High Stakes.
Pope and Schweitzer’s premise is that Tour players are often suffering from loss aversion, as they make a lower percentage of birdie putts than par putts. The term loss aversion more or less means that the Tour golfers are more averse to losing strokes to the field by three-putting and missing their par saves versus gaining strokes by making birdie putts.
The article examines the misses of Tour players through ShotLink data. They tested to see if there was a bias by Tour players in the direction of their misses (left or right) and found none. What they did find, however, were three major points:
- Tour players miss birdie putts short of the cup a higher percentage of the time than on par-or-worse putts.
- Tour players miss more birdie putts early in events.
- Tour players miss a higher percentage of birdie putts short of the cup earlier in events.
That’s how they came to their conclusion of loss aversion — Tour players are missing birdie putts short of the cup because they are afraid of hitting them too far past the cup and three-putting. And with par-or-worse putts, Tour players are missing them past the cup because they are averse to losing strokes and therefore willing to hit putts with a more aggressive speed to make sure the ball gets to the hole.
Hot Putters Misses vs. Cold Putters Misses
After discovering these miss biases based on the length of the putt, I started to examine the players who finished in the top-5 and the players who finished in the bottom-5 of the PGA Tour’s Strokes-Gained Putting statistic each week. There were some distinct patterns that the top-5 putters and the bottom-5 putters had with their misses.
Inside 20 feet
Regardless of how well the player was putting during a tournament or whether their putts were for birdie, par or bogey, the vast majority of misses ended up long of the cup. However, the bottom-5 putters would have around 8-to-10 percent of their misses end up 1 foot or more short of the hole. They would also have 10-to-15 percent of their misses end up 3 feet or more past the cup on putts inside 20 feet.
That tendency is in line with Pope and Schweitzer’s findings — the putts that missed well short were almost always birdie or eagle putts, while the putts that missed well long (3 feet or more) were almost always par or worse putts.
The misses were far more consistent with the “hot putters.” There was almost never a putt inside 20 feet that they missed 1 foot short of the hole or worse. In fact, they would rarely miss more than 3 inches short of the cup and it was usually on a green where the putt had a large amount of break, so it is more difficult to hit the putt at the right speed.
On the putts they missed long, hot putters missed 78 percent of them from 6 inches past the cup to 3 feet past the cup. Simply put, their speed control was much better than cold putters that week and even when they missed the putt they almost always had enough speed to get the ball to the cup.
Outside 20 feet
Putts longer than 20 feet are a little trickier in terms of recording the data. A golfer who misses a 25-foot putt by 6 feet generally made a much worse putt than a player with a 75-foot putt that missed by 6 feet. This is the first thing to take into account — how much remaining distance divided into the length of the original putt.
As I mentioned earlier, the general findings were that most putts from outside 20 feet– whether they were birdie or par putts — were missed short of the cup. There were very few par putt attempts outside 20-feet compared to birdie or eagle putts, however.
Once again, the hot putters had much more consistency. They kept 95 percent of the putts they missed outside 20 feet in a 3-to-10 percent leftover range. Further, they were more likely to miss long on putts outside 20 feet. Seung Yul Noh was a good example of this when he won the 2014 Zurich Classic, as he only missed two putts outside 20 feet short of the cup for the entire event. His first such putt did not come until late in Round 3.
Cold putters kept 88 percent of their missed putts outside 20 feet in a 3-to-10 percent leftover range. This begs the obvious question of why don’t they miss more outside that range if they are putting so terribly? The answer is that putts inside 20 feet are more makeable and there is a great deviation in the percentage of putts made from inside 20 feet. Putts from 3-to-15 feet separate the best putters from the rest of the Tour, so when a player is putting poorly it is usually due to their performance inside 20 feet rather than putts outside 20 feet.
In the end, hot putters tend to be much more consistent with their speed on their misses than cold putters. This simply means that when players are putting well their speed control is at its best and when they are putting poorly their speed control is normally at its worst.
True Putting Speed vs. False Speed
As I was working through the data, one client asked me why Tour players miss a higher percentage of birdie putts inside 20 feet even though they are usually missing those putts long of the cup? It’s an excellent question because if loss aversion is the issue and the player is still hitting putts inside 20 feet to the cup or past the cup, then loss aversion should not be a real issue.
Looking at the distance past the cup, however, is NOT an analysis of the speed of the putts. Speed is distance traveled over a period of time. Looking at the distance the ball has traveled past the cup is only looking at the distance traveled variable and does not include the time variable. This has caused many people to mistakenly believe that hitting a putt 17 inches past the cup is considered optimal speed for making the putt. Not only is that not a measurement of speed, but research from golf instructors such as Geoff Mangum, David Orr and Mark Sweeney show that even if we were to use the variable of distance past the cup, 17 inches past the hole would NOT be the optimal distance.
The main point is that there is NOT one optimal distance to miss a putt past the cup even if you are to use that as a measurement. On slower putts, which are either slower on the stimpmeter or uphill putts, the optimal distance past the cup is shorter.
On a very slow green on a steep incline, the optimal distance past the cup may only be 3 inches. On a very fast green with a steep downward slope, the optimal distance past the cup may be 30 inches.
In reality, the actual optimal speed as noted from experts that have researched this is 2-to-3 revolutions per second. This can cause a variety of distances past the cup depending on the green surface and the slope.
This comes back to the question of why Tour players are missing more birdie putts inside 20 feet if they are still getting to the hole? My answer is that their speed is still likely too slow when it comes to birdie putts. And the players who are “cold” tend to get confused and frustrated and end up ramming a few putts well past the cup. From there, everything goes haywire. Even the best birdie putters on Tour may have the natural instinct to hit their birdie putts at a speed of 1 revolution per second rather than 2-to-3 revolutions per second. They may even end up trying to counter that by hitting a couple of birdie putts inside 20 feet at 4 revolutions per second. They end up controlling their impulse to hit putts too softly and then hit them too hard compared to weaker putters.
And when polling Tour players and caddies as to what players they feel hit their putts the “firmest” on Tour, the top-5 players were Brandt Snedeker, Jimmy Walker, Luke Donald, Rory McIlroy and Russell Henley.
Here’s how those players finished in Birdie versus Par+ Make Percentage from 5-to-15 feet:
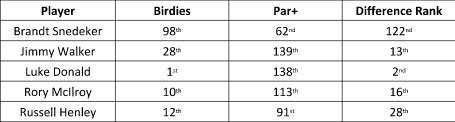
Only Snedeker ranked better in Par+ putts than Birdie putts, but he also saw the largest regression by his standards as he fell to 27th in Putts Gained, his worst season putting on Tour since 2008. While the poll was hardly scientific, it gives some indication that there may be something to using an aggressive speed on birdie putts.
Recommendations
The most negative part of struggling with loss aversion is how it affects golfers on other putts, particularly birdie putts during the round. The research data performed on the players who putt the worst in an event showed that they often miss well short on a birdie putt and then counter that by doing the exact opposite and hitting a future birdie putt too hard.
I wanted to take these findings and not only help players make more birdie putts, but also decrease their odds of three-putting as well. One of the things I have discovered with limited data is that the Tour players who used the AimPoint Express method increased their make percentage from outside 15 feet by 1.6 percent. For a Tour player, that equates to roughly 12 more putts made per year. While that may not seem like much, that can be worth roughly $325,000 for the season. That number also does not account the decreased likelihood of three-putting. After all, if you’re making more putts then you’re more likely to have closer second putts and you’re more likely to not three-putt.
I would also recommend that golfers try to find what I call their “aversion point.” I did this with myself and a few of my friends. We plotted roughly 10 rounds of putting. It is vital that you actually record this in a round of golf rather than on the practice green, because you are trying to determine where your loss aversion occurs.
Here is a real life example of a round of putts that I plotted. I sorted them in order of distance starting with putts of at least 5 feet.
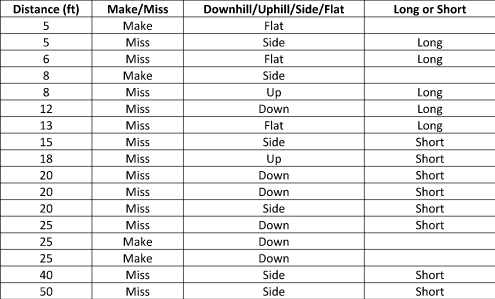
This chart is indicative of other rounds I recorded. While a Tour player’s aversion point on a putt seems to be at 20 feet, I would start to miss putts short of the hole once I had a putt that was 15-feet long. I did make two 25-foot putts, but they were both downhill so it was easier for me to get the ball to the cup. For others, the aversion point may be at 25 feet or at 8 feet. The players I plotted were no worse than 3 handicaps and typically their aversion point was from 15-to-20 feet.
While I try to avoid giving actual swing and putting instruction advice in my book, the 2014 Pro Golf Synopsis, my recommendation after speaking to several putting instructors is that if you are trying to force yourself to hit a putt with a higher rate of speed, the goal is to NOT try and hit the ball harder. Instead, increase the length of your putting stroke.
The visual for myself is to get an idea of what stroke I think I need to make on a putt outside 15 feet and then go with a stroke that is a little longer with the same rhythm and tempo so the ball gets to the hole on putts outside 15 feet.
- LIKE19
- LEGIT4
- WOW1
- LOL1
- IDHT0
- FLOP1
- OB0
- SHANK4
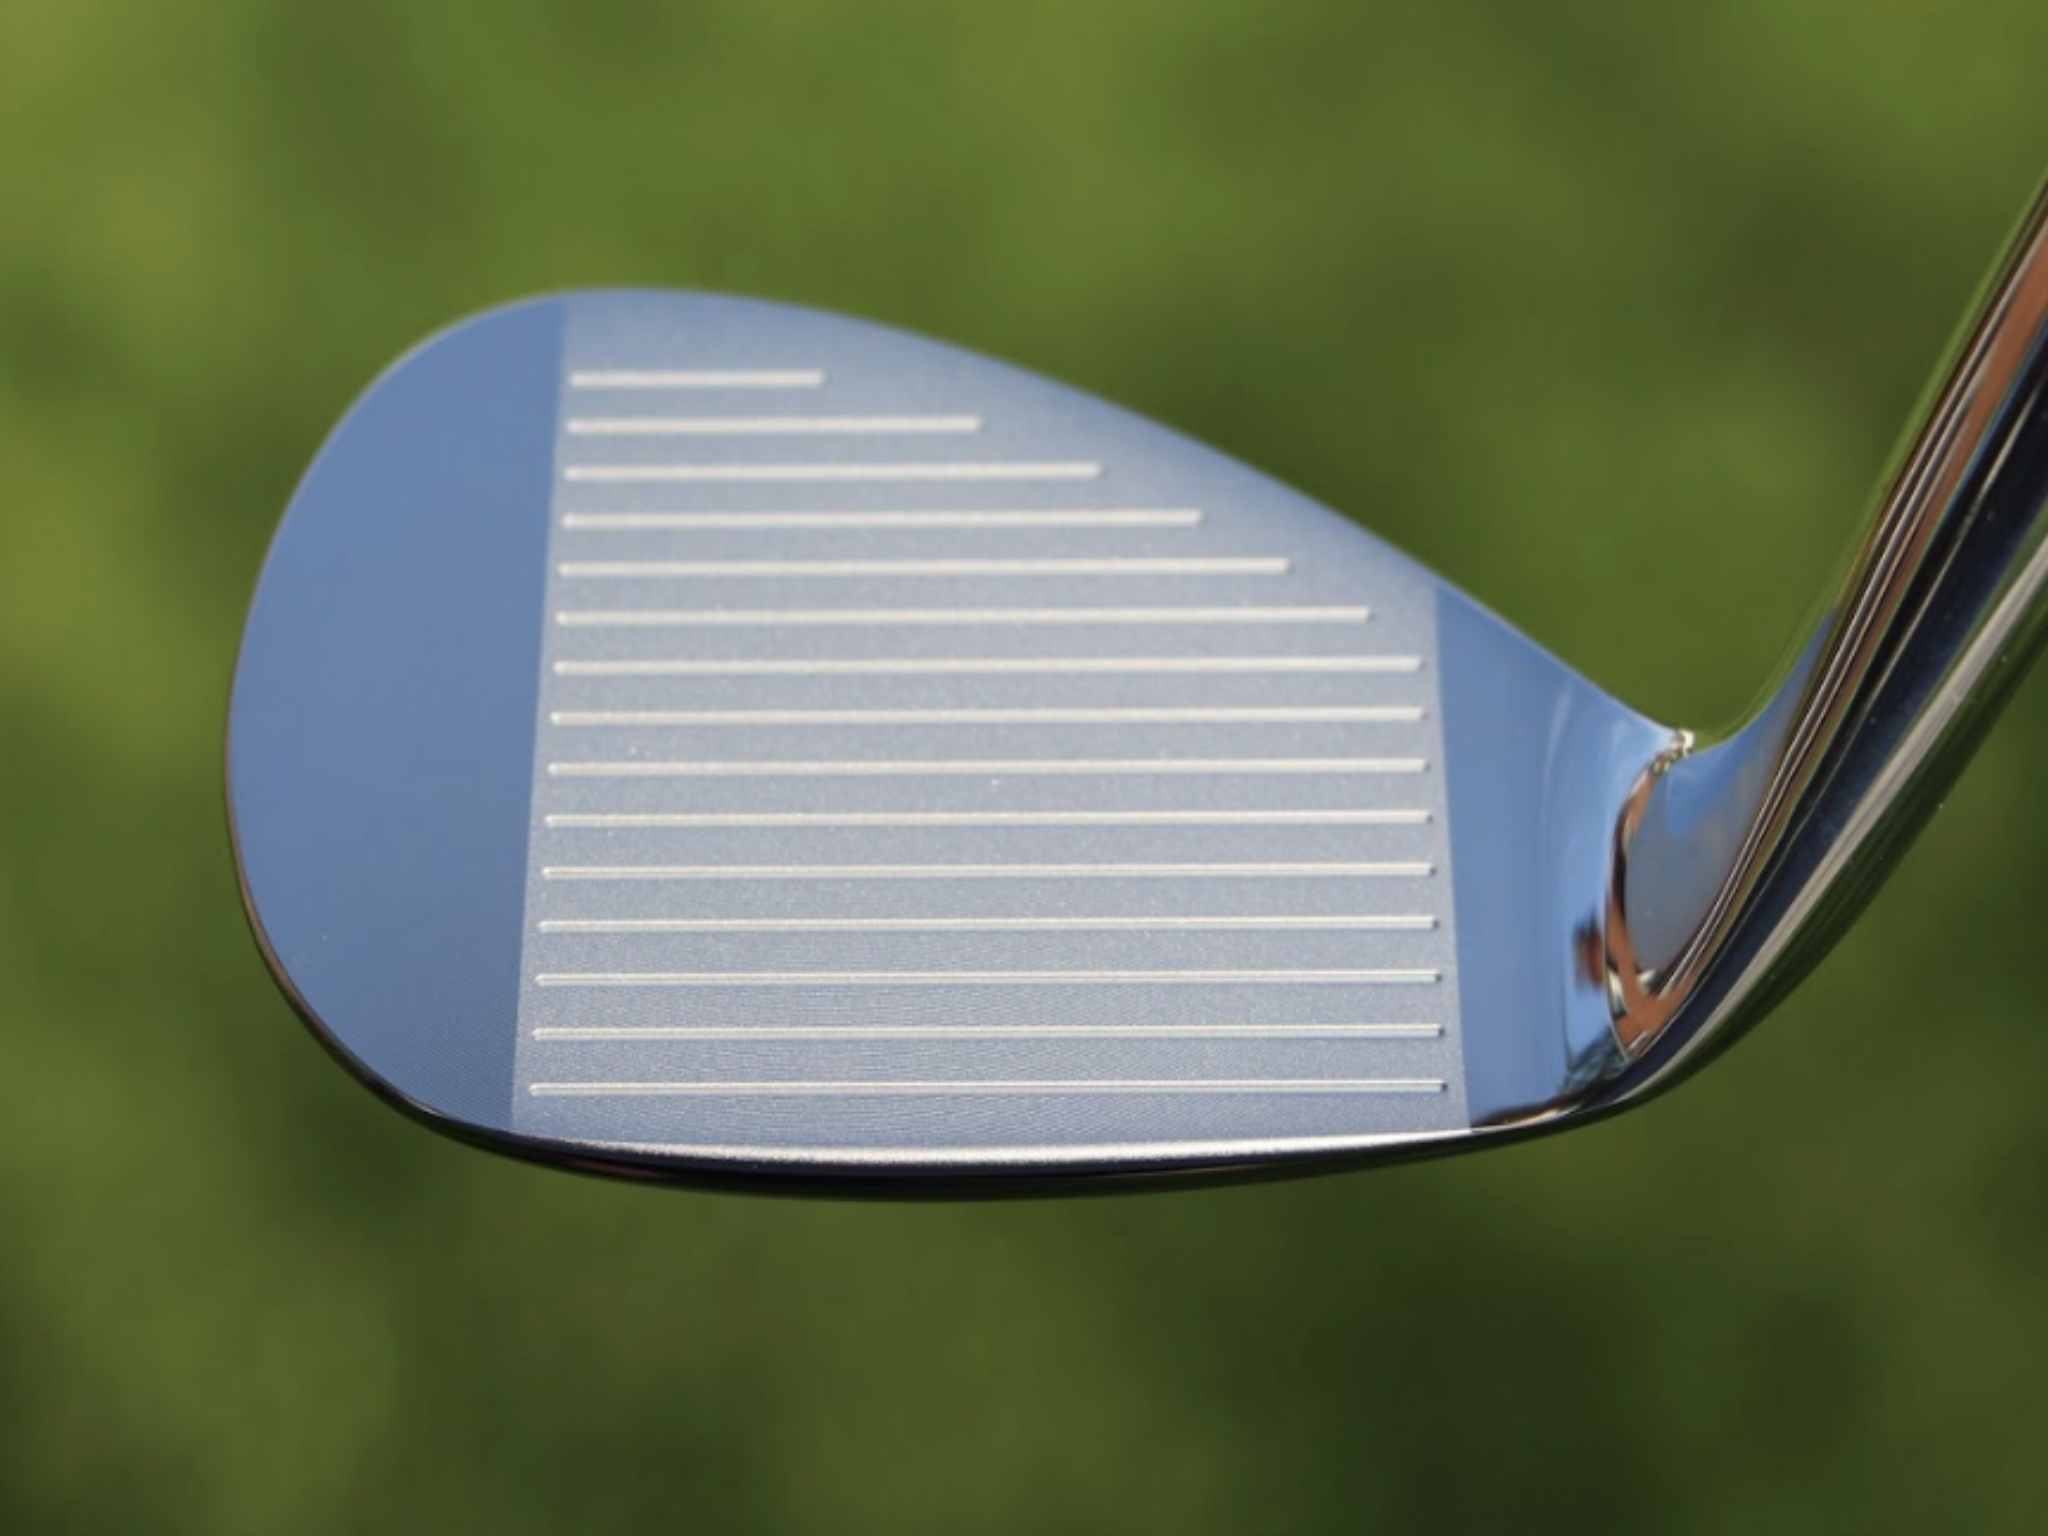
Of all the clubs in our bags, wedges are almost always the simplest in construction and, therefore, the easiest to analyze what might make one work differently from another if you know what to look for.
Wedges are a lot less mysterious than drivers, of course, as the major brands are working with a lot of “pixie dust” inside these modern marvels. That’s carrying over more to irons now, with so many new models featuring internal multi-material technologies, and almost all of them having a “badge” or insert in the back to allow more complex graphics while hiding the actual distribution of mass.
But when it comes to wedges, most on the market today are still single pieces of molded steel, either cast or forged into that shape. So, if you look closely at where the mass is distributed, it’s pretty clear how that wedge is going to perform.
To start, because of their wider soles, the majority of the mass of almost any wedge is along the bottom third of the clubhead. So, the best wedge shots are always those hit between the 2nd and 5th grooves so that more mass is directly behind that impact. Elite tour professionals practice incessantly to learn to do that consistently, wearing out a spot about the size of a penny right there. If impact moves higher than that, the face is dramatically thinner, so smash factor is compromised significantly, which reduces the overall distance the ball will fly.
Every one of us, tour players included, knows that maddening shot that we feel a bit high on the face and it doesn’t go anywhere, it’s not your fault.
If your wedges show a wear pattern the size of a silver dollar, and centered above the 3rd or 4th groove, you are not getting anywhere near the same performance from shot to shot. Robot testing proves impact even two to three grooves higher in the face can cause distance loss of up to 35 to 55 feet with modern ‘tour design’ wedges.
In addition, as impact moves above the center of mass, the golf club principle of gear effect causes the ball to fly higher with less spin. Think of modern drivers for a minute. The “holy grail” of driving is high launch and low spin, and the driver engineers are pulling out all stops to get the mass as low in the clubhead as possible to optimize this combination.
Where is all the mass in your wedges? Low. So, disregarding the higher lofts, wedges “want” to launch the ball high with low spin – exactly the opposite of what good wedge play requires penetrating ball flight with high spin.
While almost all major brand wedges have begun putting a tiny bit more thickness in the top portion of the clubhead, conventional and modern ‘tour design’ wedges perform pretty much like they always have. Elite players learn to hit those crisp, spinny penetrating wedge shots by spending lots of practice time learning to consistently make contact low in the face.
So, what about grooves and face texture?
Grooves on any club can only do so much, and no one has any material advantage here. The USGA tightly defines what we manufacturers can do with grooves and face texture, and modern manufacturing techniques allow all of us to push those limits ever closer. And we all do. End of story.
Then there’s the topic of bounce and grinds, the most complex and confusing part of the wedge formula. Many top brands offer a complex array of sole configurations, all of them admittedly specialized to a particular kind of lie or turf conditions, and/or a particular divot pattern.
But if you don’t play the same turf all the time, and make the same size divot on every swing, how would you ever figure this out?
The only way is to take any wedge you are considering and play it a few rounds, hitting all the shots you face and observing the results. There’s simply no other way.
So, hopefully this will inspire a lively conversation in our comments section, and I’ll chime in to answer any questions you might have.
And next week, I’ll dive into the rest of the wedge formula. Yes, shafts, grips and specifications are essential, too.
- LIKE20
- LEGIT6
- WOW1
- LOL1
- IDHT2
- FLOP2
- OB1
- SHANK1
Golf's Perfect Imperfections
Golf’s Perfect Imperfections: Amazing Session with Performance Coach Savannah Meyer-Clement

In this week’s episode, we spent some time with performance coach Savannah Meyer-Clement who provides many useful insights that you’ll be able to implement on the golf course.
- LIKE0
- LEGIT0
- WOW0
- LOL0
- IDHT0
- FLOP0
- OB0
- SHANK0
19th Hole
Vincenzi’s 2024 RBC Heritage betting preview: Patrick Cantlay ready to get back inside winner’s circle

Just a two-hour drive from Augusta National, the PGA TOUR heads to Harbour Town Golf Links in Hilton Head Island, S.C. Hilton Head Island is a golfer’s paradise and Harbour Town is one of the most beautiful and scenic courses on the PGA TOUR.
Harbour Town Golf Links is a par-71 that measures 7,121 yards and features Bermuda grass greens. A Pete Dye design, the course is heavily tree lined and features small greens and many dog legs, protecting it from “bomb-and-gauge” type golfers.
The field is loaded this week with 69 golfers with no cut. Last year was quite possibly the best field in RBC Heritage history and the event this week is yet another designated event, meaning there is a $20 million prize pool.
Most of the big names on the PGA Tour will be in attendance this week with the exceptions of Hideki Matsuyama and Viktor Hovland. Additionally, Webb Simpson, Shane Lowry, Gary Woodland and Kevin Kisner have been granted sponsors exemptions.
Past Winners at Harbour Town
- 2023: Matt Fitzpatrick (-17)
- 2022: Jordan Spieth (-13)
- 2021: Stewart Cink (-19)
- 2020: Webb Simpson (-22)
- 2019: CT Pan (-12)
- 2018: Sotoshi Kodaira (-12)
- 2017: Wesley Bryan (-13)
- 2016: Branden Grace (-9)
- 2015: Jim Furyk (-18)
In this article and going forward, I’ll be using the Rabbit Hole by Betsperts Golf data engine to develop my custom model. If you want to build your own model or check out all of the detailed stats, you can sign up using promo code: MATTVIN for 25% off any subscription package (yearly is best value).
Key Stats For Harbour Town
Let’s take a look at key metrics for Harbour Town Golf Links to determine which golfers boast top marks in each category over their past 24 rounds.
Strokes Gained: Approach
Strokes Gained: Approach is exceedingly important this week. The greens at Harbour Town are about half the size of PGA TOUR average and feature the second-smallest greens on the tour. Typical of a Pete Dye design, golfers will pay the price for missed greens.
Total SG: Approach Over Past 24 Rounds
- Scottie Scheffler (+1.27)
- Tom Hoge (+1.27)
- Corey Conners (+1.16)
- Austin Eckroat (+0.95)
- Cameron Young (+0.93)
Good Drive %
The fairways at Harbour Town are tree lined and feature many dog legs. Bombers tend to struggle at the course because it forces layups and doesn’t allow long drivers to overpower it. Accuracy is far more important than power.
Good Drive % Over Past 24 Rounds
- Brice Garnett (88.8%)
- Shane Lowry (+87.2%)
- Akshay Bhatia (+86.0%)
- Si Woo Kim (+85.8%)
- Sepp Straka (+85.1%)
Strokes Gained: Total at Pete Dye Designs
Pete Dye specialists tend to play very well at Harbour Town. Si Woo Kim, Matt Kuchar, Jim Furyk and Webb Simpson are all Pete Dye specialists who have had great success here. It is likely we see some more specialists near the top of the leaderboard this week.
SG: TOT Pete Dye per round over past 36 rounds:
- Xander Schauffele (+2.27)
- Scottie Scheffler (+2.24)
- Ludvig Aberg (+2.11)
- Brian Harman (+1.89)
- Sungjae Im (+1.58)
4. Strokes Gained: Short Game (Bermuda)
Strokes Gained: Short Game factors in both around the green and putting. With many green-side bunkers and tricky green complexes, both statistics will be important. Past winners — such as Jim Furyk, Wes Bryan and Webb Simpson — highlight how crucial the short game skill set is around Harbour Town.
SG: SG Over Past 24 Rounds
- Jordan Spieth (+1.11)
- Taylor Moore (+1.02)
- Wyndham Clark (+0.98)
- Mackenzie Hughes (+0.86)
- Andrew Putnam (+0.83)
5. Greens in Regulation %
The recipe for success at Harbour Town Golf Links is hitting fairways and greens. Missing either will prove to be consequential — golfers must be in total control of the ball to win.
Greens in Regulation % over past 24 rounds:
- Brice Garnett (+75.0%)
- Scottie Scheffler (+69.9%)
- Corey Conners (+69.0%)
- Shane Lowry (+68.3%)
- Patrick Rodgers (+67.6%)
6. Course History
Harbour Town is a course where players who have strong past results at the course always tend to pop up.
Course History over past 24 rounds:
- Patrick Cantlay (+2.34)
- Cam Davis (+2.05)
- J.T. Poston (+1.69)
- Justin Rose (+1.68)
- Tommy Fleetwood (+1.59)
The RBC Heritage Model Rankings
Below, I’ve compiled overall model rankings using a combination of the five key statistical categories previously discussed — SG: Approach (24%), Good Drives (20%), SG: SG (14%), SG: Pete Dye (14%), GIR (14%), and Course History (14%)
- Shane Lowry
- Russell Henley
- Scottie Scheffler
- Xander Schauffele
- Corey Conners
- Wyndham Clark
- Christiaan Bezuidenhout
- Matt Fitzpatrick
- Cameron Young
- Ludvig Aberg
2024 RBC Heritage Picks
Patrick Cantlay +2000 (FanDuel)
With the exception of Scottie Scheffler, the PGA Tour has yet to have any of their star players show peak form during the 2024 season. Last week, Patrick Cantlay, who I believe is a top-5 players on the PGA Tour, took one step closer to regaining the form that’s helped him win eight events on Tour since 2017.
Cantlay limped into the Masters in poor form, but figured it out at Augusta National, finishing in a tie for 20th and ranking 17th for the week in Strokes Gained: Ball Striking. The former FedEx Cup champion will now head to one of his favorite golf courses in Harbour Town, where he’s had immaculate results over the years. In his six trips to the course, he’s only finished worse than 7th one time. The other finishes include three third places (2017, 2019, 2023) and one runner-up finish (2022). In his past 36 rounds at Harbour Town, Cantlay ranks 1st in Strokes Gained: Total per round at the course by a wide margin (+2.36).
Cantlay is winless since the 2022 BMW Championship, which is far too long for a player of his caliber. With signs pointing to the 32-year-old returning to form, a “signature event” at Harbour Town is just what he needs to get back on the winning track.
Tommy Fleetwood +3000 (FanDuel)
I truly believe Tommy Fleetwood will figure out a way to win on American soil in 2024. It’s certainly been a bugaboo for him throughout his career, but he is simply too talented to go another season without winning a PGA Tour event.
At last week’s Masters Tournament, Fleetwood made a Sunday charge and ended up finishing T3 in the event, which was his best ever finish at The Masters. For the week, the Englishman ranked 8th in the field in Strokes Gained: Approach, 10th in Strokes Gained: Ball Striking and 16th in Strokes Gained: Putting.
Harbour Town is a perfect layout for Fleetwood, and he’s had relative success at this Pete Dye design in the past. In his four trips to the course, he’s finished inside of the top 25 three times, with his best finish, T10, coming in 2022. The course is pretty short and can’t be overpowered, which gives an advantage to more accurate players such as Fleetwood. Tommy ranks 8th in the field in Good Drive % and should be able to plot his way along this golf course.
The win is coming for Tommy lad. I believe there’s a chance this treasure of a golf course may be the perfect one for him to finally break through on Tour.
Cameron Young +3300 (FanDuel)
Cameron Young had a solid Masters Tournament last week, which is exactly what I’m looking for in players who I anticipate playing well this week at the RBC Heritage. He finished in a tie for 9th, but never felt the pressure of contending in the event. For the week, Young ranked 6th in Strokes Gained: Off the Tee and 6th in Strokes Gained: Ball Striking.
Despite being one of the longest players off the tee on the PGA Tour, Young has actually played some really good golf on shorter tracks. He finished T3 at Harbour Town in 2023 and ranks 20th in the field in Good Drive% and 16th in Greens in Regulation in his past 24 rounds. He also has strong finishes at other shorter courses that can take driver out of a players hand such as Copperhead and PGA National.
Young is simply one of the best players on the PGA Tour in 2024, and I strongly believe has what it takes to win a PGA Tour event in the very near future.
Corey Conners +5500 (FanDuel)
Corey Conners has had a disappointing year thus far on the PGA Tour, but absolutely loves Harbour Town.
At last week’s Masters Tournament, the Canadian finished T30 but ranked 20th in the field in Strokes Gained: Approach. In his past 24 rounds, Conners ranks 3rd in the field in Strokes Gained: Approach, 3rd in Greens in Regulation % and 24th in Good Drive %.
In Conners’ last four trips to Harbour Town, his worst finish was T31, last season. He finished T4 in 2021, T12 in 2022 and ranks 8th in Strokes Gained: Total at the course over his past 36 rounds.
Conners hasn’t been contending, but his recent finishes have been encouraging as he has finished in the top-25 in each of his past three starts prior to The Masters, including an impressive T13 at The PLAYERS. His recent improvement in ball striking as well as his suitability for Harbour Town makes Conners a high upside bet this week.
Shane Lowry (+7500) (FanDuel)
When these odds were posted after Lowry was announced in the field, I have to admit I was pretty stunned. Despite not offering much win equity on the PGA Tour over the last handful of years, Shane Lowry is still a top caliber player who has the ability to rise to the top of a signature event.
Lowry struggled to score at The Masters last week, but he actually hit the ball really well. The Irishman ranked 1st for Strokes Gained: Approach on the week and 7th in Strokes Gained: Ball Striking. As usual, it was the putter that let him down, as he ranked 60th in the field in Strokes Gained: Putting.
Harbour Town is most definitely one of Lowry’s favorite courses on the PGA Tour. In his six starts there, he’s finished in the top 10 three times, including third twice. Lowry is sensational at Pete Dye designs and ranks 7th in Strokes Gained: Total in his past 36 rounds on Dye tracks.
Lowry is perfect for Harbour Town. In his past 24 rounds, he ranks 5th in Strokes Gained: Approach, 2nd in Good Drive% and 5th in Green in Regulation %. If he figures it out on the greens, Shane could have his first win in America since 2015.
Lucas Glover +12000 (FanDuel)
This is one of my weekly “bet the number” plays as I strongly believe the odds are just too long for a player of Glover’s caliber. The odds have been too long on Glover for a few weeks now, but this is the first event that I can get behind the veteran being able to actually contend at.
Glover is quietly playing good golf and returning to the form he had after the understandable regression after his two massive victories at the end of 2023. He finished T20 at The Masters, which was his best ever finish at Augusta National. For the week, Lucas ranked 18th for Strokes Gained: Approach and 20th in Strokes Gained: Ball Striking.
Over his past 24 rounds, Glover ranks 9th in Strokes Gained: Approach and 13th in Good Drive %. Harbour Town is a short course that the 44-year-old will be able to keep up with the top players on Tour off the tee. He’s played the course more than 20 times, with mixed results. His best finishes at Harbour Town include a T7 in 2008, but recently has a finish of T21 in 2020.
Glover has proven he can contend with the stars of the Tour on any given week, and this number is flat out disrespectful.
- LIKE30
- LEGIT5
- WOW2
- LOL1
- IDHT1
- FLOP2
- OB0
- SHANK2


Dave Portnoy places monstrous outright bet for the 2024 Masters

John Daly stuns fans into silence with brutal opening tee shot on PGA Tour Champions

Things got heated at the Houston Open between Tony Finau and Alejandro Tosti. Here’s why

Tiger Woods arrives at 2024 Masters equipped with a putter that may surprise you

Report: Tiger Woods has ‘eliminated sex’ in preparation for the 2024 Masters

Two star names reportedly blanked Jon Rahm all week at the Masters

2-time major champ announces shock retirement from the sport at age of 33

Neal Shipley presser ends in awkward fashion after reporter claims Tiger handed him note on 8th fairway

Paulina Gretzky opens up on receiving death threats following DJ’s move to LIV Golf

Report: LIV Golf identifies latest star name they hope to sign to breakaway tour


Collin Morikawa WITB 2024 (April)
Collin Morikawa what’s in the bag accurate as of the RBC Heritage. More photos from the event here. Driver: TaylorMade...

WITB Time Machine: Jordan Spieth’s winning WITB, 2022 RBC Heritage
At the 2022 RBC Heritage Jordan Spieth defeated Patrick Cantlay on the first playoff hole after nearly holing his greenside...


Jason Day WITB 2024 (April)
Jason Day what’s in the bag accurate as of the RBC Heritage. Driver: Ping G430 LST (9 degrees @10) Shaft: TPT...


Ludvig Åberg WITB 2024 (April)
Ludvig Åberg what’s in the bag accurate as of the RBC Heritage. Driver: Titleist TSR2 (9 degrees, D4 SureFit setting)...
-
 19th Hole1 week ago
Dave Portnoy places monstrous outright bet for the 2024 Masters
-
 19th Hole3 weeks ago
Things got heated at the Houston Open between Tony Finau and Alejandro Tosti. Here’s why
-
 19th Hole1 week ago
Tiger Woods arrives at 2024 Masters equipped with a putter that may surprise you
-
 19th Hole2 weeks ago
Report: Tiger Woods has ‘eliminated sex’ in preparation for the 2024 Masters
-
 19th Hole5 days ago
Two star names reportedly blanked Jon Rahm all week at the Masters
-
 19th Hole4 days ago
Neal Shipley presser ends in awkward fashion after reporter claims Tiger handed him note on 8th fairway
-
 19th Hole3 days ago
Report: LIV Golf identifies latest star name they hope to sign to breakaway tour
-

 19th Hole2 weeks ago
Addiction, spinal fusion, and scam artists – Everything Anthony Kim revealed in candid interview with David Feherty
Steve
Dec 11, 2014 at 2:34 pm
5-15 foot range is rather big, I would hazard to guess that a very high percentage of Par putts in that range are closer to the 5 foot range. Where as the average Birdie putt in the range would be closer to 15 feet. I don’t think you are really comparing apples to apples here.
Connor
Dec 10, 2014 at 1:53 pm
I would think that tour players make more pars than birdies in general because they have shorter par putts than birdie putts. Mostly tap-ins. doesnt seem like to complicated a concept. Am I wrong?
Straightdriver235
Dec 10, 2014 at 7:34 pm
It would seem to me that par putts follow much closer in shots. When you chip from close to a green you are much, much more capable of picking a good spot to leave your shot in for the following putt, when you are hitting to a green from 150, 190 yards out, you really can’t control your leave nearly as well. a 190 yard shot 15 or even 3 feet from the hole is far more likely to be in an undesirable or less desirable spot, than say even a poorly hit chip that ends up 15 or better one hit 3 feet away from the cup. It is no surprise the players who lead in birdie conversions don’t hit a lot of greens in regulation, but happen to be very good wedge players as well as putters. When they get a wedge in their hand for a regulation shot (a par five or short par four) they make a good leave with their wedge and knock the putt in. The study speaks to the importance of giving yourself shots (leaves) you are comfortable with, not quite as much loss aversion. If you are ballstriking well and missing birdies, it may feel like the problem is you are playing with house money, but more likely it is the advantage you gain is not really significant enough to provide you momentum given the small size of the cup and the ability of your competitors to get up and down.
Joe Merlin
Dec 10, 2014 at 10:47 am
Rich,
Just looking for your list of tour players that you used for your aimpoint data.
Thanks.
Joe
Joe Merlin
Dec 10, 2014 at 10:49 am
Rich,
Sorry I didnt see your first post! My apologies.
Joe
Joe Merlin
Dec 10, 2014 at 8:47 am
Rich,
You give the data that Tour Pro’s who use aimpoint express are making 1.6% more putts than the field from 15 feet or more. Where did you get your list of pro’s and can you provide them to me? I would love to compare the strokes gained putting numbers of those players who do use the express system.
Thank you.
Joe Merlin
Richie Hunt
Dec 10, 2014 at 9:57 am
You can find this in 2014 Pro Golf Synopsis on page 67. To purchase 2014 PGS, just go to the link in my profile.
Ahmad Bateman
Dec 9, 2014 at 11:28 pm
I read through the article…very interesting. I used to be a very good putter on the web.com tour way back when and I always coached my fellow tour-players that it was all about “read and speed”. I do have a question about the stats….were the 5 to 15 footers for birdie used in the analysis the same average distance as the 5 to 15 footers for par or worse? It seems to make sense that you’ll have more 6 footers for par and 14-footers for birdie, no? That would give you the variance right there. Apologies if I misread that, I couldn’t find how the data base was compiled. Thanks.
Richie Hunt
Dec 10, 2014 at 9:56 am
There’s no way of knowing exactly what the distances were. However, I split the differences also into putts from 5-10 feet and 10-15 feet and even from those distance ranges…Tour players made a higher % of par+ putts than birdie putts. As somebody also mentioned, Mark Broadie looked at this from exactly 6-feet and again…the Tour players were making a higher percentage of par+ than birdie putts. I had considered the possibility of par+ putts being closer than average, but thru splitting it into 5-10 and 10-15 foot putts and Broadie’s finding, I don’t believe that the distance was the issue. And in the end I used the 5-15 foot range because that is where we start to see a closer split of birdie versus par+ attempts.
Ahmad Bateman
Dec 10, 2014 at 12:25 pm
Thank you Richie. I don’t doubt that many, maybe most players have some loss aversion in their putting, but I still think that some of the statistical difference and even Pope and Schweizer’s findings can be attributed to players having a better idea of the uphill or downhill slope of the putt after they have already played a shot from on or near the green, and also higher confidence in the read on a ‘comebacker’. I guess the only way to factor that element out would be to study the statistics of par putts after shots from >50 yards away, but maybe not enough of those available to be statistically relevant?
Straightdriver235
Dec 13, 2014 at 3:00 pm
Have to agree with Ahmad here. I work in the social sciences and Mr. Hunt echoes so many of my qualitative peers, they say, “if we can’t measure it, it doesn’t exist. It’s Occam’s razor.” Then you explain to them that it does exist from a quantitative perspective, and they either try to dispute you or admit the question becomes how can we measure this? The thing is, those who know by experience quantitatively what is happening yet what cannot be measured have a significant practical advantage over those who rely only on qualitative data. The other thing is that the qualitative guys go out of their way to say their knowledge is limited to what can be measured, but seem to forget this when it comes time to draw conclusions from the limited data. I doubt if you make much money from your study–perhaps I am wrong–but I’d stick with Ahmad’s quantitative, ethnographic findings on this one. If you try objectively to study something that has too many known unknowns about it, there’s not much you can objectively conclude–its Karl Popper methods 101, falsify, falsify, falsify, etc.
Mat
Dec 9, 2014 at 12:01 pm
I’m surprised you didn’t analyze one other area. How risk-averse are players with eagle putts? How risk-averse are they if they aren’t GIR, and the first putt is for par?
Risk aversion is a measurement that relates to the relative perception of who is at-risk. In other words, you can’t simply say that “based on birdie putts” and assume that’s the appropriate context. If you need to 1-putt to save par, I imagine there are fewer short putts across the board, but that’s just a hypothesis. However, the RISK is perceived that someone will “miss par”. That’s arbitrary; they are assuming risk on what is generally accepted. If they are GIR, first putt aversion is probably different from Par 3s to Par 5s.
I think what you’ve proven here is that certain putters are more or less aggressive, and that makes sense. If you want risk adversity, take it one step further. Measure players for average distance miss on first-putt birdies, and first-putt pars. I think you’ll find that birdie putts are missed-to-be-made, and that first-putt par putts are missed to go down (rarely short). That will show that players assume risk in the “Par” number. This would be interesting because we all know that the field plays holes to different averages, yet the number on the card is playing into the distance of their first putt.
Richie Hunt
Dec 10, 2014 at 9:59 am
I didn’t measure it because they didn’t have a statistic to measure it. So instead I stuck to birdie versus par+ putts. IIRC, Pope and Schweitzer looked at eagle putts as well and found the same thing (higher percentage of misses and those putts coming short of the cup more often than par+ putts).
Pat
Dec 9, 2014 at 8:46 am
It’s all mental. There is more urgency to make a putt for par or worse from the same distance as a birdie or eagle putt. The brain focuses more therefore the chances of the putt for par or worse is more likely to go in. The consequences are more dire in making that par putt to make the cut compared to the same birdie putt that helps move up the leaderboard. Why do you think it’s so difficult to maintain a lead or add to the lead? The brain inadvertently goes into “cruise” mode and relaxes and that’s when the chances of mental mistakes increases exponentially.
F&D
Dec 9, 2014 at 2:53 am
The study also needs to separate out the Par 3’s and Par 5’s from the Par 4’s, because the pressure situation can be completely different. How many of those are chip ins, or chipped close, and tap-ins on Par 5’s, included into the Strokes-Gained?
Richie Hunt
Dec 9, 2014 at 8:56 am
There are no chip ins because they are putts from 5-15 feet. Pope and Schweitzer’s study measured the difference between birdies vs. par+ putts misses from the same distance.
?
Dec 9, 2014 at 9:16 am
That’s kinda irrelevant to the article?
?
Dec 9, 2014 at 9:16 am
F&d, not Richie
F&D
Dec 9, 2014 at 2:49 am
Good study but I don’t think Sned’s percentage can be fair analysis, he’s not worried about making it as much, any more, he’s got a fat bank account now, so he’s just out there playing golf as a hobby. So his stats are going to be skewed. You can just see from the way he behaves, he’s not as focused nor desperate to make.
Focused & Desperate. Those are the main factors for wanting to make, and feeling the nerves of being forced to make. That’s about it.
?
Dec 9, 2014 at 9:37 am
You seem like a really clueless person.
!
Dec 10, 2014 at 2:37 am
Takes one to know one, ?
Jeremy
Dec 9, 2014 at 3:32 pm
I don’t think that’s something any of us can assume without knowing the guy. But it’s probably fair to say that if, one day, I did a particularly good job at work and someone gave me a $10 million bonus, I’m not sure I’d take work as seriously the following day/month/year.
Jon
Dec 8, 2014 at 11:30 pm
There have been several comments on this thread about putting not being the most important part of the game….
While I agree that many times it’s importance is overly emphasised….it is NOT on the tour level. If you want to win golf tournaments on a PGA level you need to shoot under par for four straight days….and the only way you can do that is making birdies…and the only way to do that, assuming it’s a non drivable, non reachable par 5, is to make putts. You could hit every fairway and every green and hypothetically shoot 72 everyday. Perfect ballstriking will never win anything if you two putt every green. So yes, it is the most important part of the game, but only for the worlds best.
Pat
Dec 9, 2014 at 8:50 am
I agree. There are plenty of great ball strikers on tour that should have more wins under their belt, but because of their average to mediocre putting stats, they never reach their full potential. Look at Adam Scott for example. He has the prototype swing that is perfect in every position. Very good ball striker and and drives the ball extremely well for a guy that bombs it off the tee. His putting is his achilles heel. If he could putt, he would have won more tournaments and more importantly, majors. The same could be said of Boo Weekly who isn’t as long as Adam, but an excellent ball striker who’s putting stats have always been mediocre.
Richie Hunt
Dec 9, 2014 at 9:07 am
I think many of Mark Broadie’s readers are a little confused about his statements and putting *is* important regardless if you are a Tour player or an amateur. The problem is that Broadie likes to separate the ‘long game’ vs. the ‘short game’ by taking a look at shots from 100+ yards (long game) vs. less than 100 yards (short game). It’s not a fair comparison because the distance ranges are different (theoretically, you are looking at a possible distance range of 500 yards (600 – 100) versus those < 100 yard shots).
The other problem is that it lumps putting with shots from 20-100 yard which are very unimportant shots on Tour. Conversely, it lumps shots from 100-150 yards (unimportant) with shots from 150-225 yards and driving. So it skews the importance of certain parts of the game.
For Tour players, roughly 75% of the winners on Tour putt at +0.5 putts gained *per round* (or 2 strokes gained on the green for the tournament). And usually it is more like 1 stroke gained per round (4 strokes gained putting for the event).
Putting ends up coming out to being the 2nd most important part of the game for Tour players. And the same goes for virtually any *group* of players from a certain handicap level. Of course, you may get a 5 handicap that putts extremely well and his ballstriking makes him a 5 handicap, but that is more the exception than the rule.
Double Mocha Man
Dec 8, 2014 at 5:53 pm
My take: I think most birdie putts are the result of an iron to the green, with the purpose of landing it somewhere near the hole… not a lot of thought given to the resulting putt profile.
Par putts of 5 feet or more are usually the result of a chip or short pitch, to which the player can give a lot of thought to the kind of putt he wants… left to right, right to left, uphill, etc.
So the par putt percentage is better because the player chose the type of putt profile he prefers. With birdie putts you generally take the profile you get.
Richie Hunt
Dec 8, 2014 at 7:38 pm
The question in all of this is the purpose of the Schweitzer and Pope report…that Tour players are missing birdie putts *short* of the cup versus par+ putts. So the idea isn’t so much that players are missing a higher % of birdie putts…we know that happens. What we didn’t discover until now is that they are missing them short.
Double Mocha Man
Dec 8, 2014 at 11:16 pm
Which brings us to Tiger who, in his glory days, never left a birdie putt short. Though he ran plenty of birdie putts beyond the hole giving him a 4 footer coming back. But he always made those. So he was onto something…
F&D
Dec 9, 2014 at 2:50 am
Not really. The stats don’t show that.
Pat
Dec 9, 2014 at 8:55 am
I disagree. Tiger in his prime was excellent from tee to green. His short game was also remarkable for someone who was that long off the tee. Now age has caught up with him and he’s totally lost his focus and putting after his scandal. He may deny it, but that incident messed up his psyche and he has never been the same.
Dinger
Dec 8, 2014 at 4:17 pm
Those stats aren’t as accurate as you think they would be because most par putts are going to be closer to five feet whereas birdie putts are going to be closer to fifteen feet. With that being said it would be interesting to see the difference in percent made from exactly ten feet.
Richie Hunt
Dec 8, 2014 at 4:56 pm
I did the same thing and broke the putts in smaller distance ranges. Par+ putts from 10-15 feet has an average make % of 34%, Birdie putt from 10-15 feet at 28%. 5-10 feet par+ putts are made at 60% to 51% on birdie or worse putts. As somebody noted in Mark Broadie’s ‘Every Shot counts’, the difference from 6-feet was still in favor of par+ putts by 4%.
Steve
Dec 8, 2014 at 4:58 pm
This was my first thought as well. Is there an average distance for the total putts in each category?
Jeremy
Dec 8, 2014 at 3:43 pm
This is great. I remember reading something in the New York Times about this, it might have been the same study. Can you provide a link to the original study Richie?
Richie Hunt
Dec 8, 2014 at 4:57 pm
Here you go:
http://wsb.wharton.upenn.edu/documents/research/IsTigerWoodsLossAverse.pdf
Jeremy
Dec 9, 2014 at 2:27 pm
Wow, that got into “Eyes Glazing Over” territory a LOT quicker than I was expecting. Thanks just the same!
larrybud
Dec 8, 2014 at 3:25 pm
According to Mark Broadie of “Every shot Counts”, this birdie putt vs par putt doesn’t really have the impact that you might think. From page 159:
“Sure enough, for putts between four and seven feet, pros sink 3.6% more par putts than birdie putts. But that figure doesn’t take into consideration that par putts in this range tend to be send putts, while birdie putts tend to be first putts. We already know that second putts are easier than first putts because of the learning effect.
After controlling for first-putt-second-putt differences, and controlling for uphill, downhill, and sidehill differences, the par-birdie effect is reduced by more than half. Looking at all putt distances, taking into account differences in strokes gained…and the frequency of putts, I calculate an effect of 0.1 strokes per round. But even this computation overestimates the birdie-par effect. A short first putt for par can happen after chipping from off the green, so the golfer gets to see the path of the chip before hitting his putt. Before putting, a golfer often gets to see the puts of other golfers in the group putting along a similar line.
It seems likely that the par-birdie effect is less than 0.1 strokes per round. Far more important, in my estimation, is the performance increase to be gained from going to school.”
larrybud
Dec 8, 2014 at 4:04 pm
Sorry, typo ” in this range tend to be second putts…”
Richie Hunt
Dec 8, 2014 at 4:52 pm
Broadie is using putts from only 4 to 7 feet. In my article, I’m using putts from 5-15 feet and the drop-off in make % on birdie putts is significant. And the number of birdie versus par putts from 5-15 feet is significant.
Also, I question Broadie’s comprehension of the Pope and Schweitzer article. Its main focus is *not* about players missing a higher rate of birdie putts than par+ putts. It’s about *how* the player misses the putt. The players putting from the *same* distance are more likely to miss a birdie putt short than a par+ putt. Furthermore, they miss a higher percentage of their birdie putts short *earlier* in the event than later (more in Round 1 than Round 2 than Round 3 than Round 4). That’s how Pope and Schweitzer were able to come up with the ‘loss aversion’ theory…the misses were coming up short of the cup on birdie putts and more of that was happening in the earlier rounds of the event.
As far as its importance and if we are looking at 5-15 feet instead of 4 to 7 feet, I’ll use Luke Donald since he made a great % of birdie than par putts from that distance (was almost at the same rate). He also made about 50% of his par+ putts which was close to the average and made 51% of his birdie putts which was 1st on Tour.
Let’s assume that Luke made a lower percentage of birdie putts in accordance to what the average Tour player does (makes 13% less birdie than par+ from 5-15 feet). This would mean that instead of going 54/98 on birdie putts from 5-15 feet, he would have gone 36/98 on birdie putts from that distance. That 18 strokes lost over the season would raise his Adjusted Scoring Average from 70.735 to 71.057. I would have to go into Luke’s data specifically, but that difference in Adjusted Scoring Average from missing those putts would equate to a loss of $26,065 *per event* for the average Tour player. If the average Tour player plays 25 events, that’s a loss of roughly $652K.
I’m not confident in Pope and Schweitzer’s conclusion that it is actually loss aversion. However, I do believe there is a point where golfers do not hit their putts hard enough. And it doesn’t surprise me that the guys that are considered to take very aggressive putting speeds (Donald) tend to have the largest jump in birdie putt rankings from par+ putt rankings.
Thomas Fritz
Dec 8, 2014 at 2:58 pm
The pressure
Golfraven
Dec 8, 2014 at 2:35 pm
Title is bit misleading. Guess for every player birdies come less on the scorecard because this is how hard the game is – even for folks like Spieth who had 39 Pars and 29 birdies on an awesome weekend. Its called for a reason Par 72 or 70 and not Birdie 65
Tom Stickney
Dec 8, 2014 at 12:46 pm
Once again a GREAT article by Mr Hunt!!!
Halldor Bragason
Dec 8, 2014 at 12:29 pm
what´s the percentage hot vs cold tour player makes on 10 footers ?
Lime Shark
Dec 8, 2014 at 11:33 am
My goal is to on average 2-putt.
The amount of work it would take to get it below 2 would be, imho, too much effort for too little benefit.
Richie Hunt
Dec 8, 2014 at 11:47 am
The higher your make percentage means the less 3-putts you will have. For starters, if you’re making putts…you’re not 3-putting. But, if you’re making more putts there is a strong correlation between that and how close the ball is to the cup when you miss. I personally don’t believe that realizing that a golfer’s tendency is leave putts from 20+ feet short of the hole and then adjusting for that is too much effort.
As far as the benefit, generally across the board putting is the 2nd most important facet of the game when it comes to improving score. So, if you can improve your putting on any level (going from 3 putting to 2 putting or going from 2 putting to 1 putting) it will provide a substantial benefit to your scores.
Ian
Dec 8, 2014 at 1:39 pm
Hi Richie
“generally across the board putting is the 2nd most important facet of the game” – what have you found to be the most important?
ron
Dec 8, 2014 at 2:00 pm
GIR
Richie Hunt
Dec 8, 2014 at 2:29 pm
Depends on the golfer’s handicap. For Tour players, it is shots from 175-225 yards. As the handicap gets higher, driving starts to become more important and ‘long approach shots’ become less important. However, in general the top-3 categories are driving, long approach shots and putting. ‘Long approach shots’ distance can vary due to golfers playing different length courses.
larrybud
Dec 8, 2014 at 3:30 pm
Putting’s effect is overestimated. Often quoted is the “40% of your shots are putts” stat. However, that 40% also includes tap ins, of which there is almost no room for improvement. In other words, if you have 14 tap-ins out of 32 putts, putts which can be improved upon goes from 32 down to 18 (because you make all of the tap-ins). If you shoot 80 with 32 putts (40% of which are putts), the number of putts which really mattered were 18 out of 80 shots, or 22.5%. Now take into consideration the number of putts out of those 18 which are very remote make possibility (e.g. <5% make), and you're probably down to about 10 putts which really "matter".
So what really counts is not how many putts you had, but how many you *missed*, and how many of those were truly makable.
Richie Hunt
Dec 8, 2014 at 3:57 pm
I agree with you Larry Bud. I wrote about this in 2014 Pro Golf Synopsis, it’s a myth that ‘half your strokes are on the putting green.’
If we take out everything inside 3-feet because that is considered ‘inside the leather’ and Tour players make 99.3% of their putts inside 3-feet on average, putting accounts for roughly 30% of the stokes. And given that make % from outside 25-feet is more about randomness than luck and if we were to remove those putts, the % of putting strokes that truly are part of a Tour player’s score are at 23%. For higher handicaps it is still roughly the same percentage.
Lime Shark
Dec 8, 2014 at 3:30 pm
The higher the make percentage from where?
Sure, if I could consistently make puts from outside 10, 15, or 20 feet it would be great, but the amount of practice it would take for me to get to the level would be astronomic. So astronomic that I would have to abandon practicing in other areas.
My goal on long puts is to get the ball within an area where I can consistently 1-putt (under 5 feet from the hole). Beyond that, any long putting practice time is a waste of time (imho); time that could be better used on say learning to chip the ball within 5 feet of the hole, or number of other areas.
Richie Hunt
Dec 8, 2014 at 4:16 pm
I can’t reply to your other comment for some odd reason. But, I don’t know where Pelz gets his data from because there are plenty of Tour players that make consistently over 25% of putts from 10 feet. Here’s Baddeley’s %’s made from 10-15 feet over the seasons:
2013-2014: 40%
2013: 33%
2012: 38%
2011: 30%
2010: 31%
Or Brian Gay’s:
2013-2014: 30%
2013: 35%
2012: 29%
2011: 33%
2010: 34%
Or Sergio
2013-2014: 38%
2013: 32%
2012: 30%
2011: 34%
2010: 24%
If you make a higher percentage of putts from *any* distance there is a correlation between that and how far your misses are from the cup. The putting speed component is such an important factor to *making* putts because you are increasing the ‘capture size’ of the cup if the speed on the putt is closer to optimal. And if you miss with speed of the putt closer to optimal, then you’re likely to have also have a short 2nd putt.
Players are likely to struggle with loss aversion on longer putts. Pinpointing the distance of where the golfer starts to become loss averse will not only help them make a few more putts from longer distance, but will also help stop 3-putting.
Lime Shark
Dec 8, 2014 at 5:28 pm
According to the numbers you provided, the best pros only sink between 24-40 percent of their putts in the 10-15 foot range.
If the typical amateur were to get his 10-15 yard sunk putts into the 24 percent range, how many strokes would he save per round?
If he learned to consistently land the ball on the green from 100 yards in, how many strokes per round would he save?
Limited practice time means you must set priorities.
I’m not advocating that amateurs abandon long putt practicing. I’m saying they should focus on speed and length control over pin-point accuracy. Most amateur golfers with a moderate amount of practice can learn to consistently leave a long put within a few feet of the hole.
But, how many more hours (and hours and hours and hours and hours and hours and hours) of practice would it take for that same amateur golfer to raise his hole in percentage from outside 10 feet from say 2% to the pro’s 24% range?
Is that the best use of their limited time, or would using those limited practice hours on some other aspect of the game do more to lower their scores?
Amateurs, unlike pros, rarely have time to be excellent at EVERY aspect of the game. Improvements in one area of the game often come at the expense of NOT improving another area.
Jeremy
Dec 8, 2014 at 6:07 pm
Lime Shark, I think your point is reasonable but somewhat moot. He’s not advocating that people stop practicing everything and start working on this. But if you’re going to work on your putting, this is definitely something to consider. We all know that golf is every bit as much a mental game as it is a physical one, and so I think just being aware that your brain is “lying” to you at times will save you strokes without even having to practice.
Like Richie says, if you stand over a 20 foot putt and think you’ve got the firmness figured out, be aware that you probably don’t and you’ll need to add, say, another 10%. Just like that you’ll hole more putts and your misses will be closer.
Drew R.
Dec 8, 2014 at 10:59 am
I’m a little disappointed with this excerpt. I wish this stat took account for some of the items alluded to in the beginning like where a chip or putt preceded the par putt vs. birdie putt. Also, some sort of comparison that normalizes the data by comparing all 1 putts (birdie v. par) and all 2 putts. Without this, the short stat seems less relevant.
Richie Hunt
Dec 8, 2014 at 11:43 am
Thanks for the comments. The excerpt was created to focus on the article by Pope and Schweitzer. Their article had concluded that Tour players miss a higher percentage of birdie putts than par+ putts due to ‘loss aversion’ rather than what I alluded to early in my article (‘uphill versus downill’ and par putts coming from a previous shot closer to the hole than a birdie putt). So, the purpose of my article was to examine what they showed.
I’m not really certain what you mean by normalizing all 1 putts and all 2 putts. We can’t tell much on a 1-putt because the ball went into the hole, so we don’t know if the ball was rolling at a speed slower than optimal or faster than optimal. Even if we could, it would be difficult to argue with the reader since the goal was reached (the ball went into the cup).
Teaj
Dec 8, 2014 at 1:36 pm
“Dam I hit that to hard and hit the back of the whole”
“so another birdie Jim?”
As far as amateur’s go at what distance would you say they lose the most strokes? I’m going to assume we should all be practicing shorter puts then we do when on the practice green. I am going to make another assumption that a 7 handy is going to have a different length then a 12 and so on?
Richie Hunt
Dec 8, 2014 at 2:31 pm
Depends on handicap. But I would say around 9 handicap or less it’s most important to putt well from 3 to 15 feet. Those that can make those putts from 3 to 15 feet gain the most advantage on the greens. Once the handicap gets to double digits, it starts to become more about putts from 3-25 feet. It’s extended to 25 feet because most 10+ handicaps won’t make many putts from 15-25 feet, but they also start to see themselves 3-putting more from longer distances.
Lime Shark
Dec 8, 2014 at 3:56 pm
Learn to make puts from 10-25 feet?
According to Pelz: “From 10 feet, no one consistently holes better than 25%. And from over 15 feet? One in 10, best case, even for the pros.”
Even PGA pros rarely sink putts from this distance. Why the heck should an amateur spend time trying to master a skill PGA pro’s can’t master?
Amateurs do not have unlimited practice time, so they need to spend their limited practice time on areas that will give them the most benefit.
The benefits of of becomming “good” at sinking putts from the 10-25 range are marginal at best, especially considering the amount of limited practice time that would be required to achieve those marginal benefits.
Lime Shark
Dec 8, 2014 at 4:10 pm
10+ handicappers 3 putt more from 10-25 feet, because they spend too much time trying to master sinking putts from those distances. Time they could be using instead to learn how to sink every putt within 6 feet–a realistic goal, even for amateurs.
Spend just enough time on your long putting practice to master getting the ball into your kill zone–the radius around the hole where you can sink puts every time. Then spend the rest of your putting practice time ensuring your are a putting monster within that radius from the hole.
Stephen Hawking
Dec 9, 2014 at 2:11 pm
Drew R. is right, Richie. You should look into it – it would make the article/numbers much more stable.
Interesting article but way too long, too many typos, and too difficult to understand what we’re supposed to do with the information. It seems like the main point goes back to the cliches, get it to the hole; hit every shot like it’s for a million bucks; and 100% of the short ones don’t go in.