Opinion & Analysis
Using statistics and launch monitor data to shoot lower scores
As a statistician who works with PGA Tour players, I’m frequently asked by aspiring Tour players and their coaches what statistics they can use to measure themselves against Tour players.
The mistake with this question is that the playing grounds for aspiring Tour players and actual PGA Tour players are often different. In fact, metrics on the PGA Tour can change drastically from one event to another. For instance, the average make percentage of putts from 3-to-5 feet for the year is roughly 87 percent. At the AT&T Pebble Beach National Pro-Am, however, the average make percentage for professionals from 3-to-5 feet was only 76 percent. Thus, a golfer that made 80 percent of their putts from 3-to-5 feet would be putting poorly on many Tour courses, but doing better than average at Pebble Beach. And the same applies for shot proximity to the cup. Some courses are easier than others and for aspiring Tour players. It is not easy to gauge their performance versus the PGA Tour players performance since it depends on the degree of difficulty of the course.
Don’t get me wrong. I do think that using PGA Tour benchmarks can be useful, but expecting that they will provide golfers with an accurate depiction of how the average Tour player would perform on a course is misleading at best. Instead, I advise golfers to focus on what I call their “game profile.” A game profile is various strengths and weaknesses of a golfer’s game. It’s how well they putt, drive the ball, what happens when they drive it effectively or ineffectively, how well they hit their short approach shots, mid-length approach shots and long approach shots and how well they perform with their short game around the green.
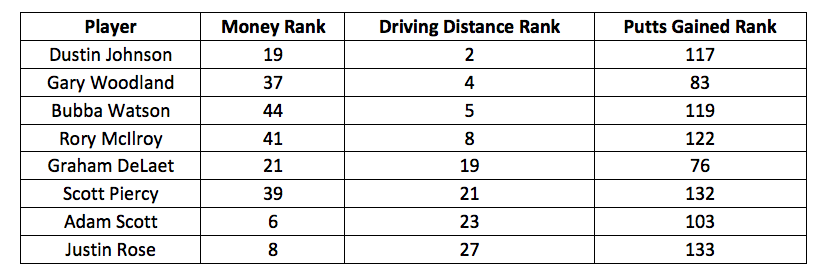
The game profile starts with power and how far a golfer hits the ball off the tee. How far a golfer hits the ball dictates what the rest of their game will generally have to look like in order to achieve success. But first, what we should understand is that the biggest advantage to hitting the ball far is that it affects how well golfers will have to putt the ball. And the farther a golfer hits the ball, the more likely he or she can get away with poor putting. Here is a chart showing many of the super-long hitters on Tour and their 2013 PGA Tour performance in money, driving distance and the strokes gained – putting categories.
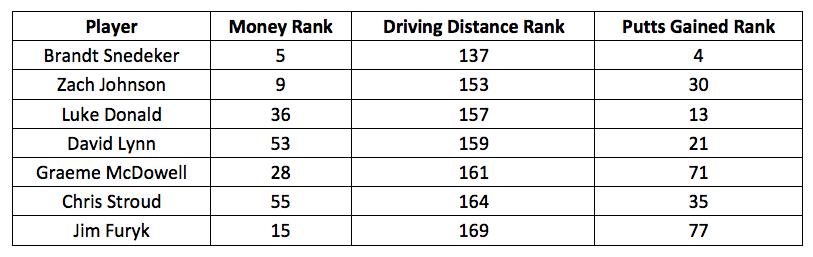
Conversely, here’s a look at the shorter hitters on Tour that were successful and their rankings.
The biggest reason why the long hitters can get away with weaker putting is that they often have the distance to play the par-5’s in two shots like they are par-4’s. And they are getting more birdie opportunities on those holes, because they’re often hitting it closer to the cup.
The problem with using distance for the aspiring Tour player is that virtually every golfer who tells me how far they hit the ball will give me a number of when they hit the ball the best without the weather conditions affecting their distance. Even Tour players do not consistently make great contact with the ball and are far from being overly consistent with how far they hit their driver.
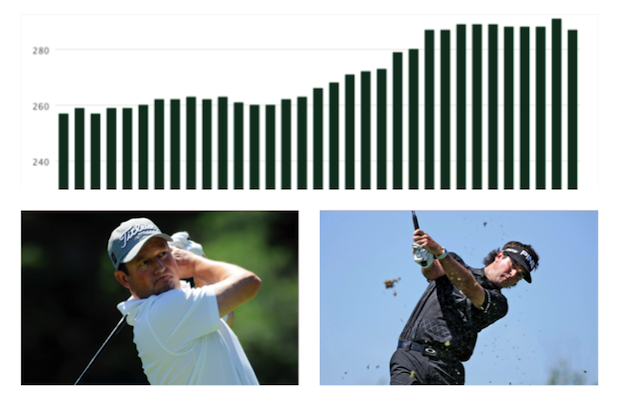
And that is where launch monitors can help. In 2013, the average club head speed on Tour was 113.6 mph. The highest club head speed was 124.5 mph by Charlie Beljan, and the lowest was 104.7 mph by Jin Park. These numbers should give an initial indication of how much power a golfer has compared to the Tour.
Another important factor to consider is the attack angle. I am not trying to advocate any particular attack angle for a golfer. We know that all things being equal, the more golfers hit up on the ball with a well-fit driver the farther the ball will travel. Therefore, if a golfer has a very downward attack angle, but generates 113.6 mph of club head speed, he or she is effectively now as powerful off the tee as a golfer that may have less club head speed, but hits well up on the driver.
Lastly, we need to consider the Apex Height. The average apex height of a Tour player in 2013 was 96.9 feet. The highest was 131.7 feet by Jason Day. And the lowest apex height was 67.5 feet from Scott Langley. There is a statistical correlation between a player’s apex height and success on Tour. While it is not a strong mathematical correlation, it is substantial enough that it warrants attention. Obviously, golfers with higher club head speeds generally will hit the ball higher, but there are many low club head speed players that hit the ball high and have had resounding success like Brandt Snedeker, Ben Crane, Mark Wilson and Luke Donald, to name a few. What my research has uncovered is that there are too many courses on Tour that favor golfers with higher ball trajectories. I attribute this to the modern course designs, which have more forced carries than older courses.
Once a golfer gets their club head speed and attack angle readings, they can start to determine how much power they have off the tee compared to the rest of the Tour. And for any player, I generally recommend a goal of keeping their fairway bunkers hit to under 5 percent (roughly one fairway bunker hit every other round). As far as hitting the fairways goes, it is rather simple. The farther golfers hit the ball, the lower percentage of fairways they have to hit. Here is a chart of the recommended goal of fairway percentage hit based on club head speed in order to be effective off the tee:
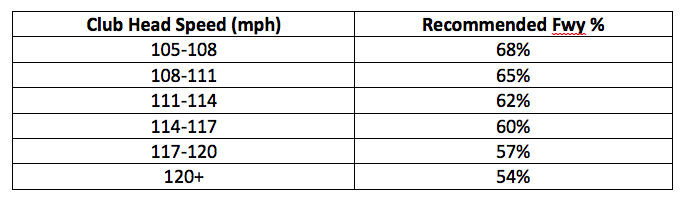
When we examine the table showing the successful lower club head speed players and putting combined with the recommended fairway percentages by club head speed table, we start to see that it becomes virtually impossible to make the PGA Tour if you cannot generate at least 104 mph of club head speed. Once a golfer gets below 104 mph, it requires them to hit such a high percentage of fairways and to putt so incredibly well that they are going to have a hard time keeping their card because golfers can only be so accurate and putt so well.
This leads into power and its influence on the game profile and the player’s ability to hit approach shots. I break down approach shots into three different zones:
- Birdie Zone (shots from 75-to-125 yards)
- Safe Zone (shots from 125-to-175 yards)
- Danger Zone (shots from 175-to-225 yards)
In general, the Danger Zone is the most important zone in golf. In fact, it has the strongest mathematical correlation to success on Tour. Regardless of club head speed, the player’s performance on Tour is largely dictated by how well they play from the Danger Zone. And there is not a substantial correlation between club head speed and Danger Zone play.
My research leads me to believe that this is because the Danger Zone shots requires golfers to have directional and distance control, whereas shots from the Birdie and Safe Zones are more distance-control oriented. The angle for error from the Danger Zone diminishes because it is such a long shot. So while generating more club head speed will have golfers hitting shorter clubs from the Danger Zone, the angle of error diminishes so much that golfers with slower club head speeds like Jim Furyk, Zach Johnson, Luke Donald and Graeme McDowell can get the advantage because of their superior directional control from this zone.
What often happens with the long hitters is that they may not actually be that skillful with their irons, but still rank well from the Danger Zone. This is because most of their Danger Zone shots are coming on the Par-3’s. When the rest of the field is playing a long par-4 and can only manage to leave themselves with 175-to-225 yard shots into the green, the long bombers can hit their drives to 125-to-175 yards. This is one of Bubba Watson’s strengths, because historically he has not been a good iron player. If there was a contest from 200 yards between Bubba and Jim Furyk, I would take Furyk. The difference is that in competition Bubba is hitting his approach shots from a much shorter distance than Furyk the majority of the time and that levels the playing field, or even gives the advantage to the lesser skilled iron player.
As I discussed earlier, the shorter hitters normally have to putt better because they cannot hit their second shots as close to the hole on the par-5’s as the long hitters. This also means that slower club head speed players need to hit it better from 100-to-150 yards in order to catchup to the rest of the field on those par-5’s. Shots from 100-125 yards are generally where the shorter hitter will end up laying up to. Even if their “money yardage” is less than 100 yards, the majority of the time they can only lay up to 100-to-125 yards. And if they hit a weaker tee shot, then their lay-up shot tends to move more towards 125-to-150 yards.
Here is a table showing some notable players’ 2013 ranking on shots from 100-to-125 yards and their club head speed with the driver.
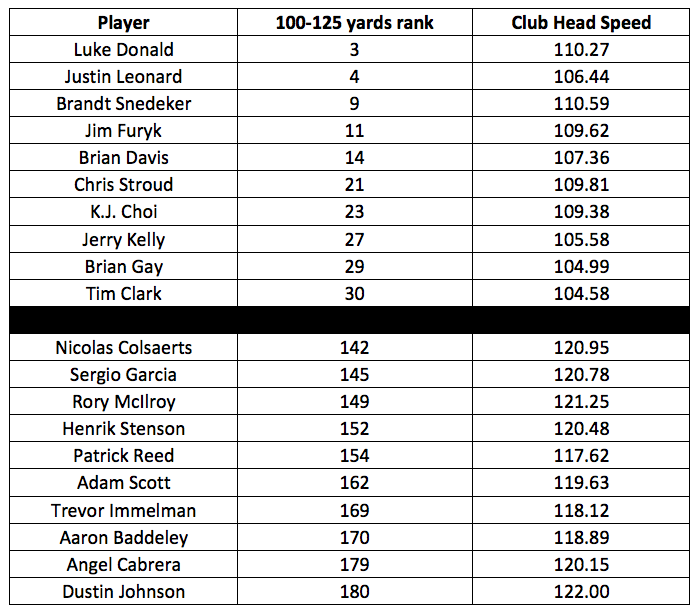
If the higher club head speed players were better from 100-to-125 yards, it would have a positive impact on their performance. However, due to their high club head speed, performing well from 100-to-125 yards is a lower priority than it is for the lower club head speed players.
The game profiles are something that the average amateur can use as well. For example, golfers who play to a 10 handicap but hit the ball short for that handicap level and do not foresee themselves increasing their club head speed substantially in the future may want to follow the example set. There is a warning; the distance of the “Zones” changes for amateurs because they are playing shorter courses. So if golfers are playing courses that are roughly 6,000-to-6,300 yards, their ‘Danger Zone’ will about 150-to-200 yards and the Birdie Zone will be about 50-t0-100 yards. But the same game profile concept will remain the same.
The shorter-than-your-average-10 handicap player may want to work more on his putting, focus more on hitting more fairways and on his wedge play. The longer-than-your-average-10 handicapper may want to focus on keeping his drives in play more often so they can use that length to his advantage. This can help players from all levels take the path needed to shoot better scores.
- LIKE7
- LEGIT4
- WOW1
- LOL0
- IDHT0
- FLOP0
- OB0
- SHANK1


The PGA TOUR heads to New Orleans to play the 2023 Zurich Classic of New Orleans. In a welcome change from the usual stroke play, the Zurich Classic is a team event. On Thursday and Saturday, the teams play best ball, and on Friday and Sunday the teams play alternate shot.
TPC Louisiana is a par 72 that measures 7,425 yards. The course features some short par 4s and plenty of water and bunkers, which makes for a lot of exciting risk/reward scenarios for competitors. Pete Dye designed the course in 2004 specifically for the Zurich Classic, although the event didn’t make its debut until 2007 because of Hurricane Katrina.
Coming off of the Masters and a signature event in consecutive weeks, the field this week is a step down, and understandably so. Many of the world’s top players will be using this time to rest after a busy stretch.
However, there are some interesting teams this season with some stars making surprise appearances in the team event. Some notable teams include Patrick Cantlay and Xander Schauffele, Rory McIlroy and Shane Lowry, Collin Morikawa and Kurt Kitayama, Will Zalatoris and Sahith Theegala as well as a few Canadian teams, Nick Taylor and Adam Hadwin and Taylor Pendrith and Corey Conners.
Past Winners at TPC Louisiana
- 2023: Riley/Hardy (-30)
- 2022: Cantlay/Schauffele (-29)
- 2021: Leishman/Smith (-20)
- 2019: Palmer/Rahm (-26)
- 2018: Horschel/Piercy (-22)
- 2017: Blixt/Smith (-27)
2024 Zurich Classic of New Orleans Picks
Tom Hoge/Maverick McNealy +2500 (DraftKings)
Tom Hoge is coming off of a solid T18 finish at the RBC Heritage and finished T13 at last year’s Zurich Classic alongside Harris English.
This season, Hoge is having one of his best years on Tour in terms of Strokes Gained: Approach. In his last 24 rounds, the only player to top him on the category is Scottie Scheffler. Hoge has been solid on Pete Dye designs, ranking 28th in the field over his past 36 rounds.
McNealy is also having a solid season. He’s finished T6 at the Waste Management Phoenix Open and T9 at the PLAYERS Championship. He recently started working with world renowned swing coach, Butch Harmon, and its seemingly paid dividends in 2024.
Keith Mitchell/Joel Dahmen +4000 (DraftKings)
Keith Mitchell is having a fantastic season, finishing in the top-20 of five of his past seven starts on Tour. Most recently, Mitchell finished T14 at the Valero Texas Open and gained a whopping 6.0 strokes off the tee. He finished 6th at last year’s Zurich Classic.
Joel Dahmen is having a resurgent year and has been dialed in with his irons. He also has a T11 finish at the PLAYERS Championship at TPC Sawgrass which is another Pete Dye track. With Mitchell’s length and Dahmen’s ability to put it close with his short irons, the Mitchell/Dahmen combination will be dangerous this week.
Taylor Moore/Matt NeSmith +6500 (DraftKings)
Taylor Moore has quickly developed into one of the more consistent players on Tour. He’s finished in the top-20 in three of his past four starts, including a very impressive showing at The Masters, finishing T20. He’s also finished T4 at this event in consecutive seasons alongside Matt NeSmith.
NeSmith isn’t having a great 2024, but has seemed to elevate his game in this format. He finished T26 at Pete Dye’s TPC Sawgrass, which gives the 30-year-old something to build off of. NeSmith is also a great putter on Bermudagrass, which could help elevate Moore’s ball striking prowess.
- LIKE6
- LEGIT3
- WOW1
- LOL1
- IDHT0
- FLOP3
- OB1
- SHANK1

After having four of the top twelve players on the leaderboard at The Masters, LIV Golf is set for their fifth event of the season: LIV Adelaide.
For both LIV fans and golf fans in Australia, LIV Adelaide is one of the most anticipated events of the year. With 35,000 people expected to attend each day of the tournament, the Grange Golf Club will be crawling with fans who are passionate about the sport of golf. The 12th hole, better known as “the watering hole”, is sure to have the rowdiest of the fans cheering after a long day of drinking some Leishman Lager.
The Grange Golf Club is a par-72 that measures 6,946 yards. The course features minimal resistance, as golfers went extremely low last season. In 2023, Talor Gooch shot consecutive rounds of 62 on Thursday and Friday, giving himself a gigantic cushion heading into championship Sunday. Things got tight for a while, but in the end, the Oklahoma State product was able to hold off The Crushers’ Anirban Lahiri for a three-shot victory.
The Four Aces won the team competition with the Range Goats finishing second.
*All Images Courtesy of LIV Golf*
Past Winners at LIV Adelaide
- 2023: Talor Gooch (-19)
Stat Leaders Through LIV Miami
Green in Regulation
- Richard Bland
- Jon Rahm
- Paul Casey
Fairways Hit
- Abraham Ancer
- Graeme McDowell
- Henrik Stenson
Driving Distance
- Bryson DeChambeau
- Joaquin Niemann
- Dean Burmester
Putting
- Cameron Smith
- Louis Oosthuizen
- Matt Jones
2024 LIV Adelaide Picks
Cameron Smith +1400 (DraftKings)
When I pulled up the odds for LIV Adelaide, I was more than a little surprised to see multiple golfers listed ahead of Cameron Smith on the betting board. A few starts ago, Cam finished runner-up at LIV Hong Kong, which is a golf course that absolutely suits his eye. Augusta National in another course that Smith could roll out of bed and finish in the top-ten at, and he did so two weeks ago at The Masters, finishing T6.
At Augusta, he gained strokes on the field on approach, off the tee (slightly), and of course, around the green and putting. Smith able to get in the mix at a major championship despite coming into the week feeling under the weather tells me that his game is once again rounding into form.
The Grange Golf Club is another course that undoubtedly suits the Australian. Smith is obviously incredibly comfortable playing in front of the Aussie faithful and has won three Australian PGA Championship’s. The course is very short and will allow Smith to play conservative off the tee, mitigating his most glaring weakness. With birdies available all over the golf course, there’s a chance the event turns into a putting contest, and there’s no one on the planet I’d rather have in one of those than Cam Smith.

Louis Oosthuizen +2200 (DraftKings)
Louis Oosthuizen has simply been one of the best players on LIV in the 2024 seas0n. The South African has finished in the top-10 on the LIV leaderboard in three of his five starts, with his best coming in Jeddah, where he finished T2. Perhaps more impressively, Oosthuizen finished T7 at LIV Miami, which took place at Doral’s “Blue Monster”, an absolutely massive golf course. Given that Louis is on the shorter side in terms of distance off the tee, his ability to play well in Miami shows how dialed he is with the irons this season.
In addition to the LIV finishes, Oosthuizen won back-to-back starts on the DP World Tour in December at the Alfred Dunhill Championship and the Mauritus Open. He also finished runner-up at the end of February in the International Series Oman. The 41-year-old has been one of the most consistent performers of 2024, regardless of tour.
For the season, Louis ranks 4th on LIV in birdies made, T9 in fairways hit and first in putting. He ranks 32nd in driving distance, but that won’t be an issue at this short course. Last season, he finished T11 at the event, but was in decent position going into the final round but fell back after shooting 70 while the rest of the field went low. This season, Oosthuizen comes into the event in peak form, and the course should be a perfect fit for his smooth swing and hot putter this week.

- LIKE12
- LEGIT3
- WOW0
- LOL1
- IDHT0
- FLOP1
- OB1
- SHANK1
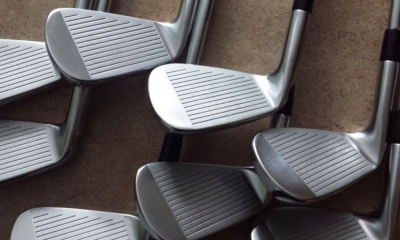
Of all the clubs in our bags, wedges are almost always the simplest in construction and, therefore, the easiest to analyze what might make one work differently from another if you know what to look for.
Wedges are a lot less mysterious than drivers, of course, as the major brands are working with a lot of “pixie dust” inside these modern marvels. That’s carrying over more to irons now, with so many new models featuring internal multi-material technologies, and almost all of them having a “badge” or insert in the back to allow more complex graphics while hiding the actual distribution of mass.
But when it comes to wedges, most on the market today are still single pieces of molded steel, either cast or forged into that shape. So, if you look closely at where the mass is distributed, it’s pretty clear how that wedge is going to perform.
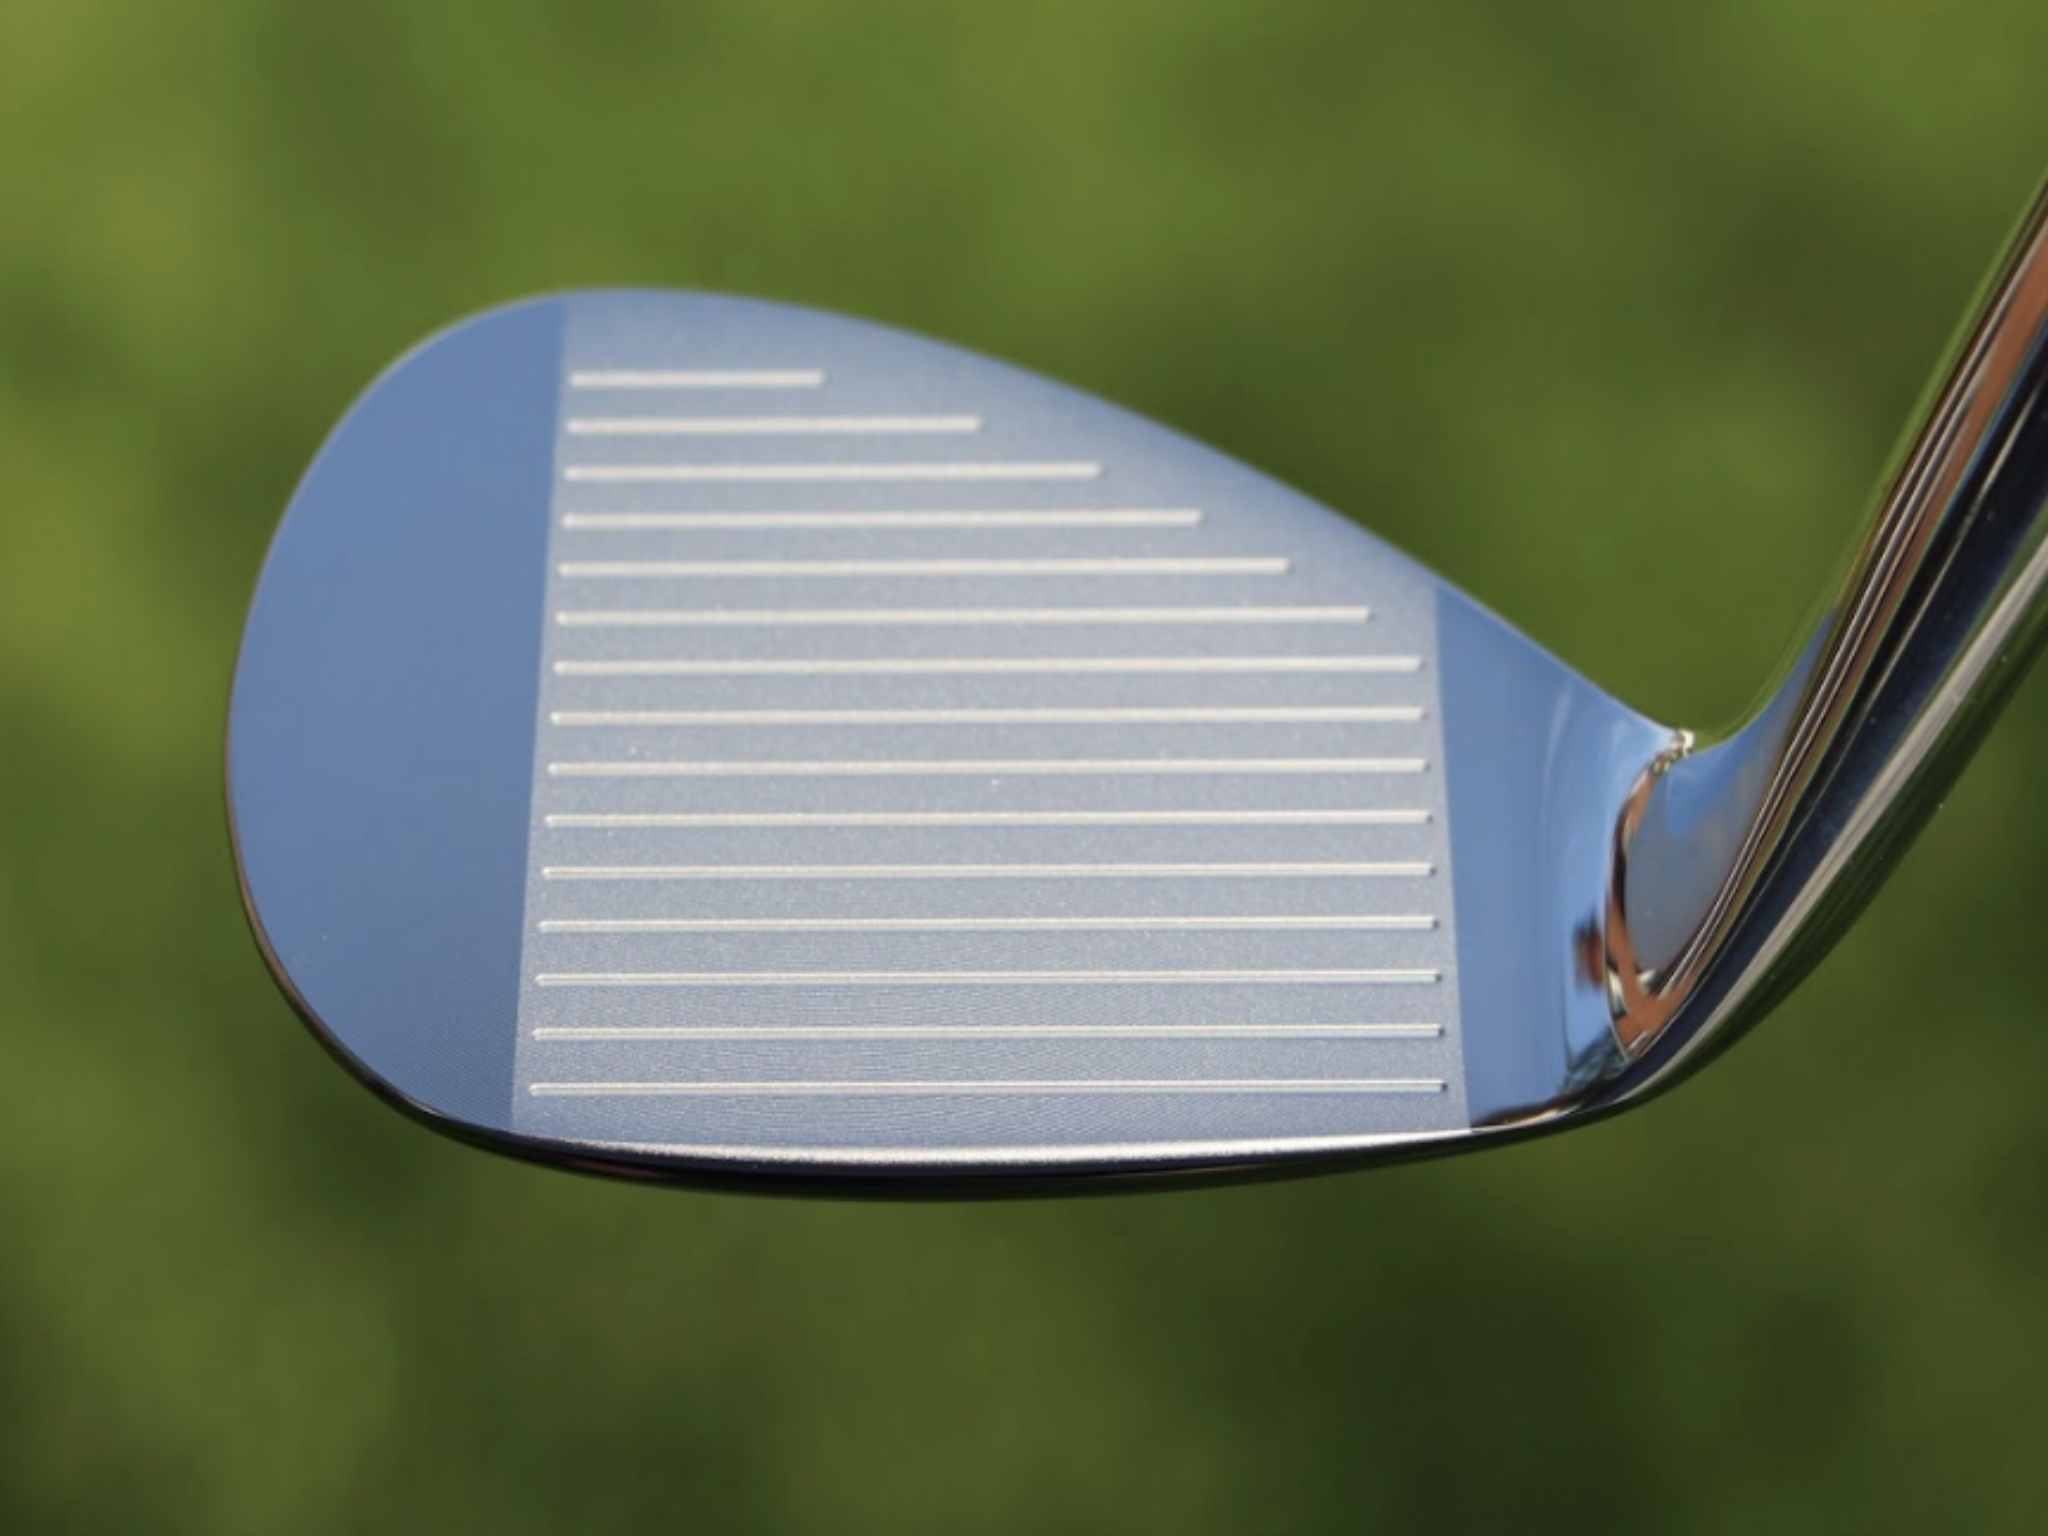
To start, because of their wider soles, the majority of the mass of almost any wedge is along the bottom third of the clubhead. So, the best wedge shots are always those hit between the 2nd and 5th grooves so that more mass is directly behind that impact. Elite tour professionals practice incessantly to learn to do that consistently, wearing out a spot about the size of a penny right there. If impact moves higher than that, the face is dramatically thinner, so smash factor is compromised significantly, which reduces the overall distance the ball will fly.
Every one of us, tour players included, knows that maddening shot that we feel a bit high on the face and it doesn’t go anywhere, it’s not your fault.
If your wedges show a wear pattern the size of a silver dollar, and centered above the 3rd or 4th groove, you are not getting anywhere near the same performance from shot to shot. Robot testing proves impact even two to three grooves higher in the face can cause distance loss of up to 35 to 55 feet with modern ‘tour design’ wedges.
In addition, as impact moves above the center of mass, the golf club principle of gear effect causes the ball to fly higher with less spin. Think of modern drivers for a minute. The “holy grail” of driving is high launch and low spin, and the driver engineers are pulling out all stops to get the mass as low in the clubhead as possible to optimize this combination.
Where is all the mass in your wedges? Low. So, disregarding the higher lofts, wedges “want” to launch the ball high with low spin – exactly the opposite of what good wedge play requires penetrating ball flight with high spin.
While almost all major brand wedges have begun putting a tiny bit more thickness in the top portion of the clubhead, conventional and modern ‘tour design’ wedges perform pretty much like they always have. Elite players learn to hit those crisp, spinny penetrating wedge shots by spending lots of practice time learning to consistently make contact low in the face.
So, what about grooves and face texture?
Grooves on any club can only do so much, and no one has any material advantage here. The USGA tightly defines what we manufacturers can do with grooves and face texture, and modern manufacturing techniques allow all of us to push those limits ever closer. And we all do. End of story.
Then there’s the topic of bounce and grinds, the most complex and confusing part of the wedge formula. Many top brands offer a complex array of sole configurations, all of them admittedly specialized to a particular kind of lie or turf conditions, and/or a particular divot pattern.
But if you don’t play the same turf all the time, and make the same size divot on every swing, how would you ever figure this out?
The only way is to take any wedge you are considering and play it a few rounds, hitting all the shots you face and observing the results. There’s simply no other way.
So, hopefully this will inspire a lively conversation in our comments section, and I’ll chime in to answer any questions you might have.
And next week, I’ll dive into the rest of the wedge formula. Yes, shafts, grips and specifications are essential, too.
- LIKE32
- LEGIT7
- WOW1
- LOL1
- IDHT2
- FLOP3
- OB1
- SHANK3


Dave Portnoy places monstrous outright bet for the 2024 Masters

John Daly stuns fans into silence with brutal opening tee shot on PGA Tour Champions

Things got heated at the Houston Open between Tony Finau and Alejandro Tosti. Here’s why

Tiger Woods arrives at 2024 Masters equipped with a putter that may surprise you

‘Absolutely crazy’ – Major champ lays into Patrick Cantlay over his decision on final hole of RBC Heritage

Report: Tiger Woods has ‘eliminated sex’ in preparation for the 2024 Masters

Justin Thomas on the equipment choice of Scottie Scheffler that he thinks is ‘weird’

Two star names reportedly blanked Jon Rahm all week at the Masters

2-time major champ announces shock retirement from the sport at age of 33

Report: LIV Golf identifies latest star name they hope to sign to breakaway tour


Rasmus Højgaard WITB 2024 (April)
Rasmus Højgaard what’s in the bag accurate as of the Zurich Classic. Driver: Callaway Ai Smoke Triple Diamond (10.5 degrees)...


Rory McIlroy WITB 2024 (April)
Rory McIlroy what’s in the bag accurate as of the Zurich Classic. Driver: TaylorMade Qi10 (9 degrees) Shaft: Fujikura Ventus...


Sam Burns WITB 2024 (April)
Sam Burns’ what’s in the bag accurate as of the RBC Heritage. Driver: Callaway Paradym Triple Diamond S (9 degrees...


Will Zalatoris WITB 2024 (April)
Will Zalatoris’ what’s in the bag accurate as of the RBC Heritage. Driver: Titleist TSR2 (9 degrees, A1 SureFit setting)...
-
 19th Hole2 weeks ago
Dave Portnoy places monstrous outright bet for the 2024 Masters
-
 19th Hole2 weeks ago
Tiger Woods arrives at 2024 Masters equipped with a putter that may surprise you
-
 19th Hole1 day ago
‘Absolutely crazy’ – Major champ lays into Patrick Cantlay over his decision on final hole of RBC Heritage
-
 19th Hole3 weeks ago
Report: Tiger Woods has ‘eliminated sex’ in preparation for the 2024 Masters
-
 19th Hole2 days ago
Justin Thomas on the equipment choice of Scottie Scheffler that he thinks is ‘weird’
-
 19th Hole1 week ago
Two star names reportedly blanked Jon Rahm all week at the Masters
-
 19th Hole1 week ago
Report: LIV Golf identifies latest star name they hope to sign to breakaway tour
-

 19th Hole1 week ago
Neal Shipley presser ends in awkward fashion after reporter claims Tiger handed him note on 8th fairway
Hudson
Apr 2, 2014 at 4:58 pm
I have recently calculated on a full round of 18 holes the gained/lost strokes compared to a PGA pro and based on the “gained stokes concept” implemented by Mr Broadie.
Let me share with you my results that will interest quite a few of you down here 😉
The great advantage of the method is that it quantifies the number of strokes you loose on each part of your game. I found this new concept a revolution ! I for example can now focus on my long game (>165 yards)of my game where I “lost” 6 strokes last week…
See below the complete calculations and explanations I made:
http://golf-made-in-us.blogspot.com/2014/04/golf-stats-revolution-gained-strokes.html
Mike
Mar 14, 2014 at 10:33 am
Great read, thanks for posting it. One question: are those tour statistics readily available for the average person to see?
Peter Maki
Mar 14, 2014 at 1:48 am
Great article. As a mechanical engineer aspiring to play professionally I enjoy reading this technical analysis type stuff. Keep it up!
RollTheRock
Mar 13, 2014 at 10:29 am
Great article, but how do I know if I am a “shorter than average 10-hcp”? Do you have a table with average distance per handicap?
RollTheRock
Mar 13, 2014 at 10:50 am
As a follow up, if you are a shorter than average 10, and you improve upon the other aspects of your game, your handicap will drop, making you a significantly shorter than average 6 or wherever you get to. It almost seems like there is an implied floor to how low your handicap can within reason based on distance off the tee. If you hit the ball 250, which is average for let’s say a 10hcp, and get down to a 5, to improve further assuming you can’t get any more distance off the tee, you would have to become incredibly accurate or an amazing putter. It would be awesome if there was some way to quantify this. A chart or data that says to be a scratch golfer with an average distance of 250yds off the tee, you would typically have to hit x% of fwys, gain y strokes from the danger zone, and gain z strokes putting. And then perhaps be able to play with x, y and z. For instance, I can hit x% of fairways but I don’t gain enough strokes in the danger zone, however I can gain z+ strokes putting.
Sorry for the nerd rant, but that would be cool.
Philip
Mar 13, 2014 at 11:53 am
I second the request for that info, if available. Definitely would be cool to have!
Richie Hunt
Mar 13, 2014 at 1:47 pm
That was one of the parts I struggled with. There were some researchers from Australia that did research and found that handicap and club head speed do have a very strong correlation to each other. They did a regression analysis to come up with a handicap to ball speed analysis, but I could not get the formula to compute correctly. Something I am working on.
anonymous
Mar 14, 2014 at 9:57 am
http://www.nytimes.com/2008/07/21/sports/golf/21pennington.html?pagewanted=all&_r=0
This is a related article on what to work on based on statistical analysis.
Basically, you take your fractional remaining length (distance remaining to target / total distance from original spot). If your FRL is ~5-6% you should be hitting it 297 yards, ~8-9% 248 yards, ~12% 237 yards, 17.3% 216 yards. If you hit it farther, work on your short game, if you hit it shorter work on your long game.
joe sixpack
Mar 13, 2014 at 12:02 am
This is definitely better than your article last August about whether Trackman is ruining golf.
I have 2 beefs with this.
First, the title. “Statistics & Launch Monitor Data”. The only launch monitor data you use in this article is club head speed. All of the rest of the data is from Shotlink. You mention that it’s important to hit up on a driver and it helps to hit a high ball, but you give no analysis or data on these issues. When I clicked on this story, I was expecting something about Trackman and all of the awesome data it provides. I felt teased.
Second, what is your main point? Shorter hitters need to be straighter drivers, better wedge players and better putters to compete with longer hitters? Duh! Do you need to crunch a bunch of data to convince people of that?
The structure of this article is also a bit of a mess.
Here’s an outline of your article:
– Tour averages vary from course to course. (So what? This has nothing to do with the rest of your article.)
– Pros need to look at their individual strengths and weaknesses.
– The longer you hit the ball, the worse you can be at putting and still compete.
– Shorter hitters that succeed on tour are good putters.
– Launch monitors help you maximize distance for a given swing speed.
– Longer hitters don’t have to hit as many fairways to be competitive.
– Longer hitters have shorter and easier approach shots.
Your argument boils down to this: longer hitters have an advantage. No one will argue with that. Tell us something interesting.
Richie Hunt
Mar 13, 2014 at 9:12 am
I used more than just club head speed. I discussed attack angle and also used Apex Height of the ball. I also never discussed ‘launch monitors help you maximize distance for a given club head speed.’ The article does not recommend any particular attack angle, but it discusses power, how to more accurately measure it and understand how this will impact the rest of yoru game.
Lastly, long hitters do not always have easier approach shots. If they are in the fairway bunker or deep rough or the trees, that’s not the case. That’s why long hitters rarely win at Sawgrass (Tiger won last year, but was hitting 3-wood on virtually every hole). As I stated in the article, they are likely to have more easier shots into par-5’s. However, they still have to keep the ball on the grid. A player like Luke List didn’t stand a chance last year despite being the longest player on Tour because he couldn’t keep the ball in play.
Mike
Mar 13, 2014 at 10:38 am
+1 on this. I was expecting some analysis on swing speed vs. ball speed or something…
Richie Hunt
Mar 13, 2014 at 1:45 pm
I tend to avoid using ball speed because there are many factors to ball speed and often times the ball speed measurement is not quite accurate. I also think that the average golfer relates more to club head speed than they do ball speed.
Tom Stickney
Mar 12, 2014 at 10:49 pm
Awesome analysis…big fan of your work.
Dan
Mar 12, 2014 at 10:38 pm
Well written and insightful article Richie. I especially liked the club head speed and recommended fairway percentage. I’ll definitely be able to apply that when looking over my own stats. Keep the great articles coming! Cheers.
marcel
Mar 12, 2014 at 6:49 pm
what a brilliant article. great research and great write up.
Philip
Mar 12, 2014 at 5:42 pm
Awesome! Helps me know what to focus on this spring to maximize my game fast.
joselo
Mar 12, 2014 at 4:55 pm
this is not helping settin down my golf addiction; great article!
Travis
Mar 12, 2014 at 4:50 pm
These types of articles with statistics are more informative for me. It breaks down the stereotype of trying to hit it farther. For a recreational golfer like myself, we constantly read articles and see commercials on how to hit it far just to have bragging rights. This article just proves how hitting it far is not always a good thing to do.
Richie Hunt
Mar 12, 2014 at 5:15 pm
Thanks for the kind words. I think my main point is that there are more than one way to shoot better scores and to understand what power does for a golfer’s game. If you are legitimately able to add 25 yards to your game and still be fairly consistent doing so, I would certainly take it. But if you can’t legitimately add substantial power and you hit it short, you need to look at putting better and hitting your wedges better while finding more fairways.
W
Mar 12, 2014 at 4:29 pm
Love the plethora of information, kudos to the author. Another way to analyze our games and take them to the next level…..
The dude
Mar 12, 2014 at 2:05 pm
Love this stuff !!!!….bring more (on puttin %)
8thehardway
Mar 12, 2014 at 12:01 pm
Fascinating! As a shorter-than-average 8 handicapper, I’ll always lack the go-low potential of longer hitters but as long as my up & downs are roughly equal to the GIRs I’m giving away straight drives and short game focus let me compete with friends 20 years younger and 30 yards longer. And when I can depend on my short game, there is less pressure to attempt a high trajectory, 180 yard approach shot; in effect, I can shrink the danger zone on a hole-by-hole basis by playing to my strengths rather than gambling on my weakness.
jon olson
Mar 12, 2014 at 11:12 am
this is an exceptionally well written article. one of the best i have seen on dictating the correlation between the PGA tour courses, the skill set they demand and the strengths and weaknesses of each individual player on tour. excellent read for coaches and players alike!
Evan
Mar 12, 2014 at 10:36 am
There is obviously a Long game/ Short game teeter-totter effect. Do you think this has something to do with the nature of golf and it’s equipment? I often think that these long hitters would benefit from a balanced approach to their swings and equipment. More 43″/ 100 g shafted drivers in the hands of the high swing speed players would increase their consistency (not as big of difference in feel from driver to irons).
The driver swing is different than the iron/ wedge swing… is it a coincidence that no one does both really well?